Visa Stock Analysis: Is Visa a Strong Opportunity Ahead of Q4 Earnings?
$325.48
28 Jan 2026, 19:25
Bullish
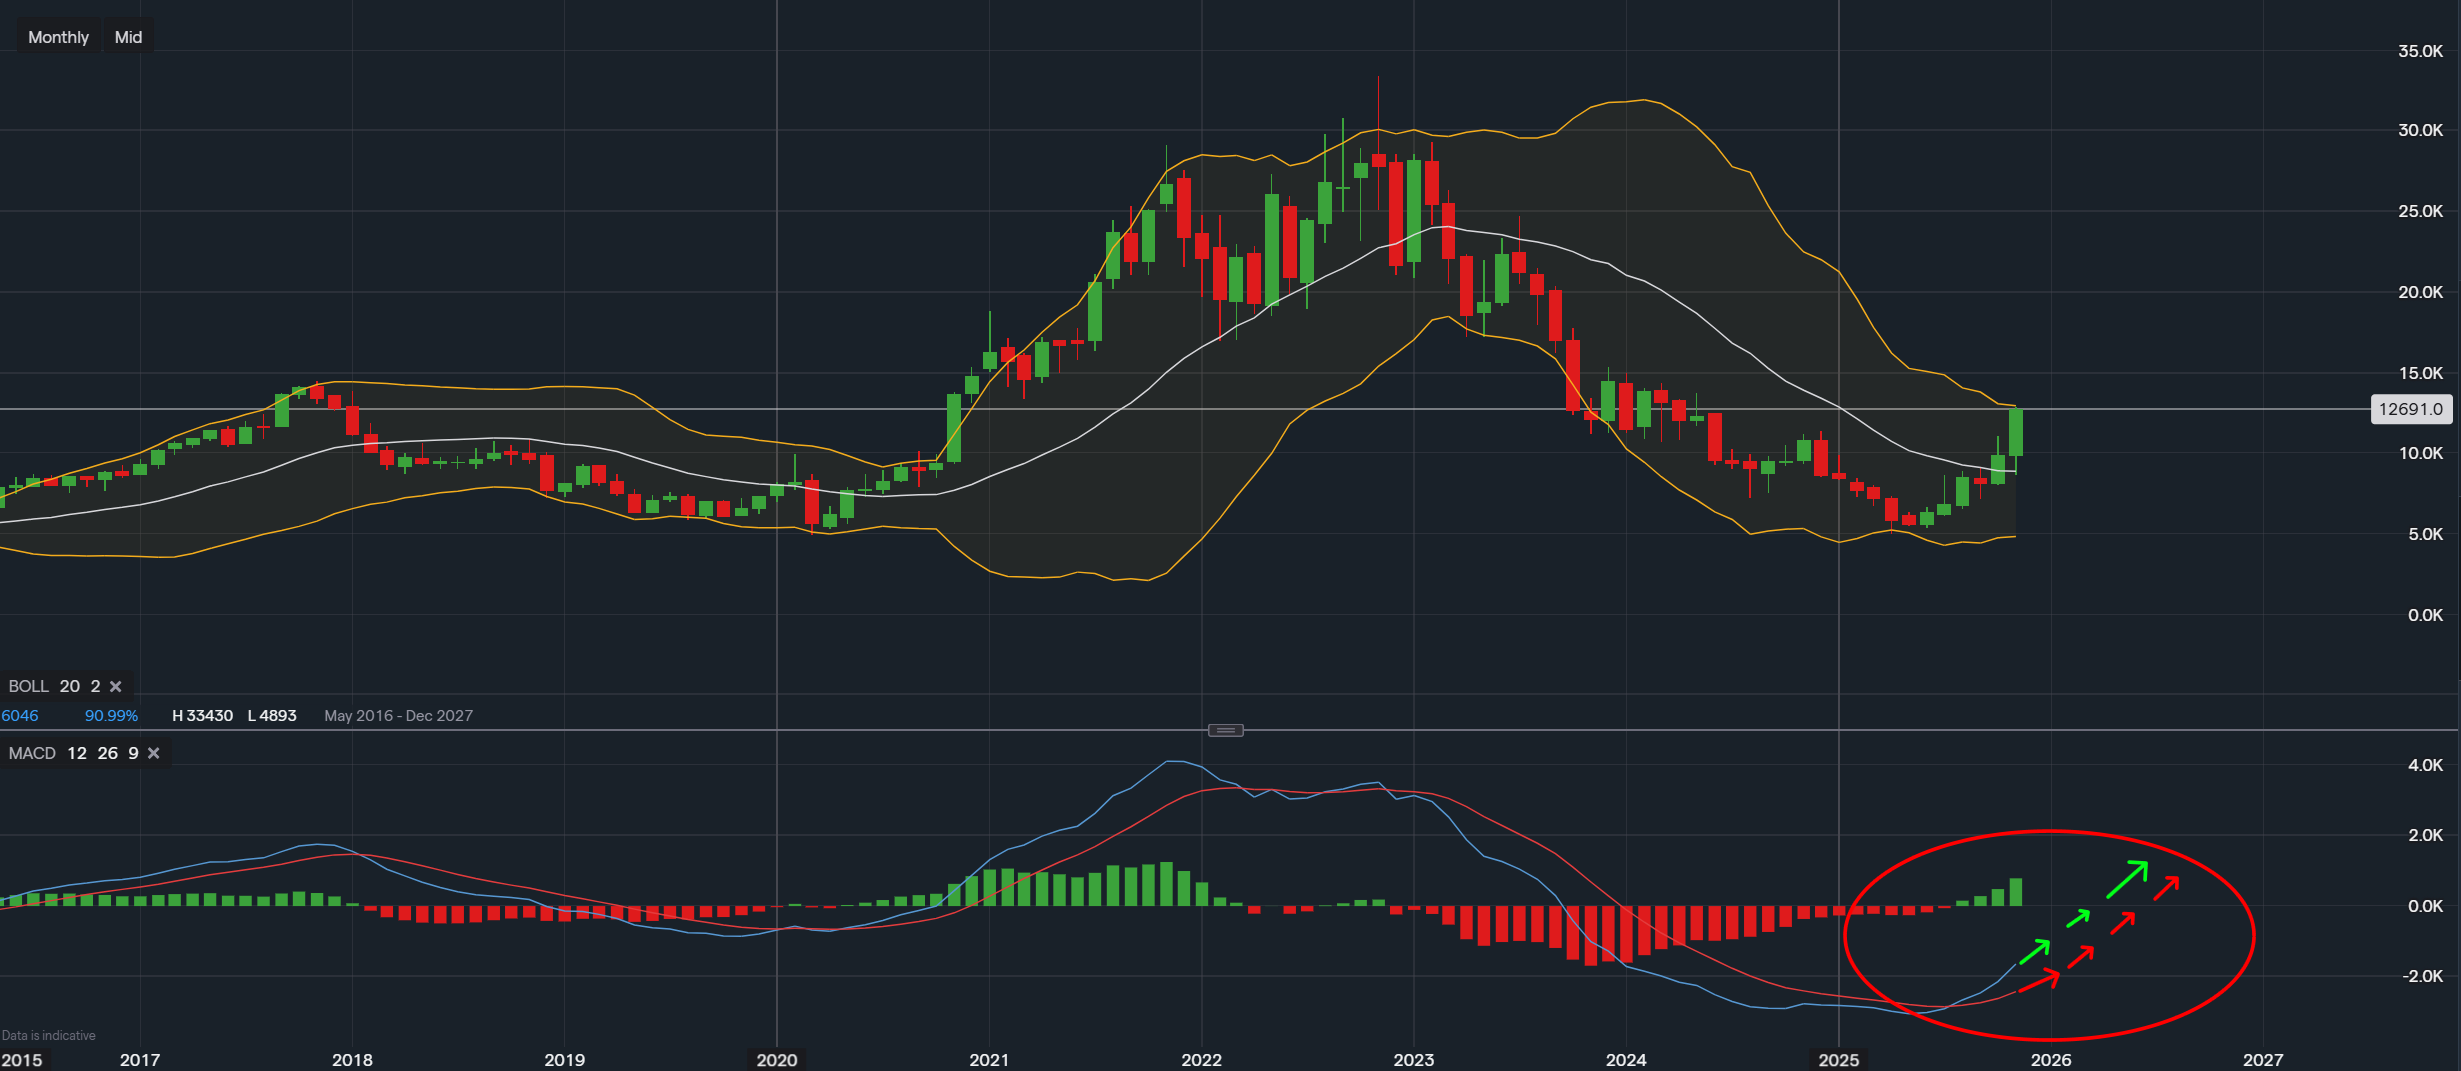
Data From IG - Timeframe - Monthly
Market Overview
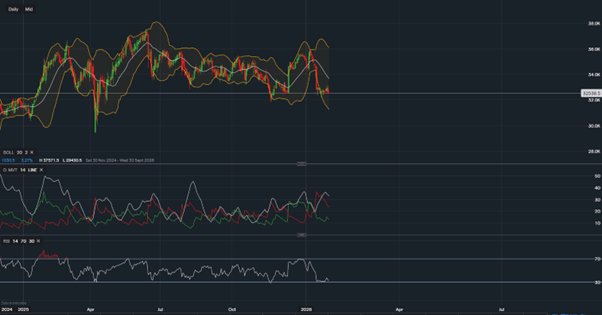
Albemarle Corp’s long term chart is beginning to show encouraging signs that the extended period of downside pressure may finally be easing. One of the most notable developments is the price lifting away from the lower Bollinger Band after a prolonged stretch of weakness. When a market begins to reclaim space within the Bollinger structure following a deep decline, it often signals that selling fatigue is emerging and early accumulation is taking shape. The strong recent green monthly candle supports this view, demonstrating renewed interest and a shift in sentiment after months of compression and bearish drift.
The MACD further strengthens this picture. After spending a long period in negative territory, the histogram has begun to contract, with deep red bars giving way to lighter tones before transitioning into early green. This shift typically reflects fading downside pressure and the early formation of positive momentum. The MACD lines, now curving upward beneath the zero line, align with the early stages of a potential long term momentum reset, often preceding a more sustained trend if this progression continues.
Even with this improving structure, the upward path is expected to include natural pullbacks. As price approaches the mid Bollinger region or encounters prior supply zones, brief pauses are likely. These pullbacks, however, may support further strength as long as the MACD continues rising and positive momentum remains intact. Together, the interplay of Bollinger Bands and MACD suggests Albemarle may be carving out the early foundation for a longer term recovery.
 Data From IG - Timeframe - Weekly
Weekly Prospective
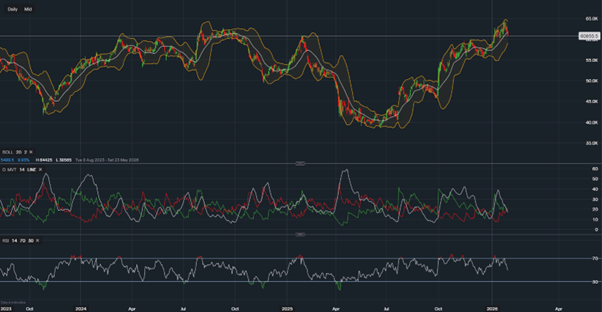
The weekly chart reinforces the broader shift underway. Albemarle has moved firmly away from recent lows, and the Bollinger Bands are widening again after a long period of contraction. This widening signals a resurgence in volatility and stronger buying participation, especially as price interacts more consistently with the upper band. While this can at times indicate short term overextension, it typically reflects genuine strength in a developing uptrend.
The MACD on the weekly timeframe shows a clean bullish crossover, with expanding green histogram bars indicating steadily building momentum since mid 2025. This combination of widening Bollinger Bands and strengthening MACD is characteristic of early stage trend reversals, where a stock begins transitioning from heavy selling into controlled recovery.
Structurally, support has developed in the $80–$90 region, a level that has repeatedly acted as a reliable base for buyers. To the upside, price is now challenging the $120–$127 area, the former descending channel’s upper boundary and a key resistance zone. A decisive break above this region would add weight to the argument that the larger downtrend is fading. Any pullbacks toward support in the meantime may simply represent healthy consolidation phases within an early recovery cycle.
As long as Albemarle holds above its newer support base and momentum remains constructive, the potential for continued upside remains. The chart even leaves room for medium-term targets around the $150 area if the trend continues to develop smoothly. While short term pauses are likely, especially near the upper Bollinger Band, these may act as resets rather than signs of weakness under the current momentum structure.
Conclusion
Across both the long-term and weekly perspectives, Albemarle Corp is showing a growing alignment of positive technical factors. The recovery away from the lower Bollinger Band, combined with increasingly supportive MACD momentum, paints the picture of a market emerging from extended bearish conditions. While short term pullbacks are still likely, they appear more consistent with consolidation within a strengthening trend rather than renewed downside risk. If price continues to build above its recent support zones and challenges key resistance levels with conviction, Albemarle may be in the early stages of a broader recovery cycle, offering a constructive technical backdrop for the months ahead.
Disclaimer
This analysis is for informational purposes only and should not be considered financial advice. Investors and traders should conduct their own research and consider individual risk tolerance before making any investment decisions.

Tradable assets:
Min.Deposit:
Max Leverage:
FCA:

Rating:


 Earnings Calendar
  Economic Calendar
  VAT Calculator
  Tax Free Childcare Calculator
 Percentage Calculator
 Compound Interest Calculator
  Loan Overpayment Calculator
 Mortgage Calculator
 Credit Card Calculator