Alphabet A Stock Analysis: Oversold Opportunity or Continued Downtrend?
$274.19
29 Mar 2026, 13:55
Bullish

Join Minipip Academy and access free courses in investing, trading, economics, and more.
Sign Up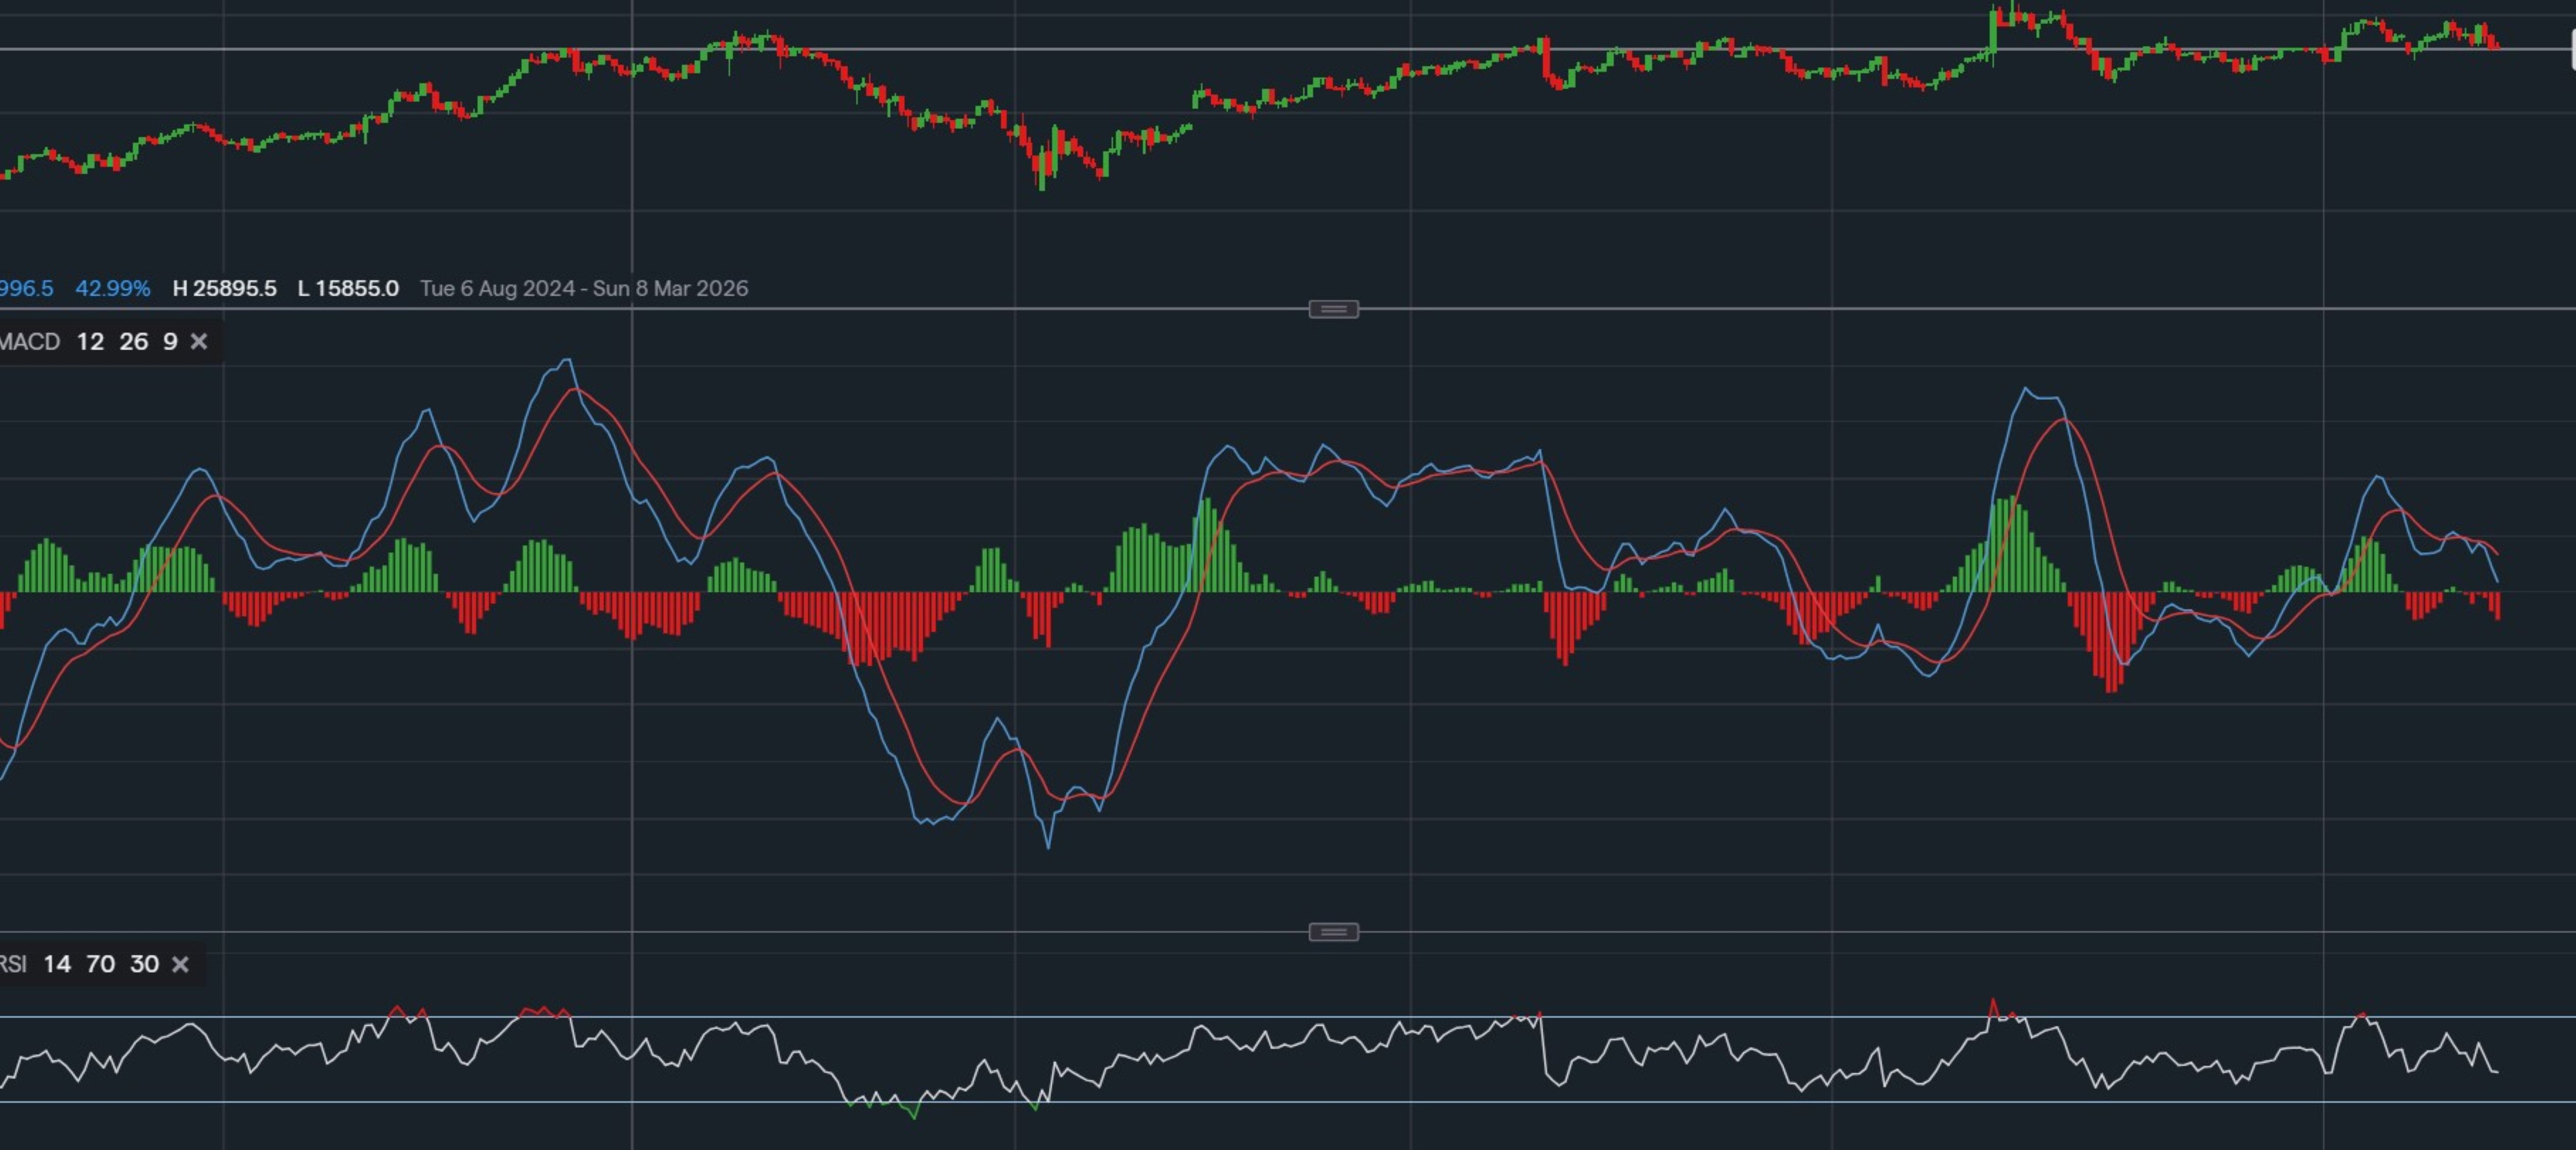
Bullish Setup Builds Ahead of Earnings
Key Indicators at a Glance
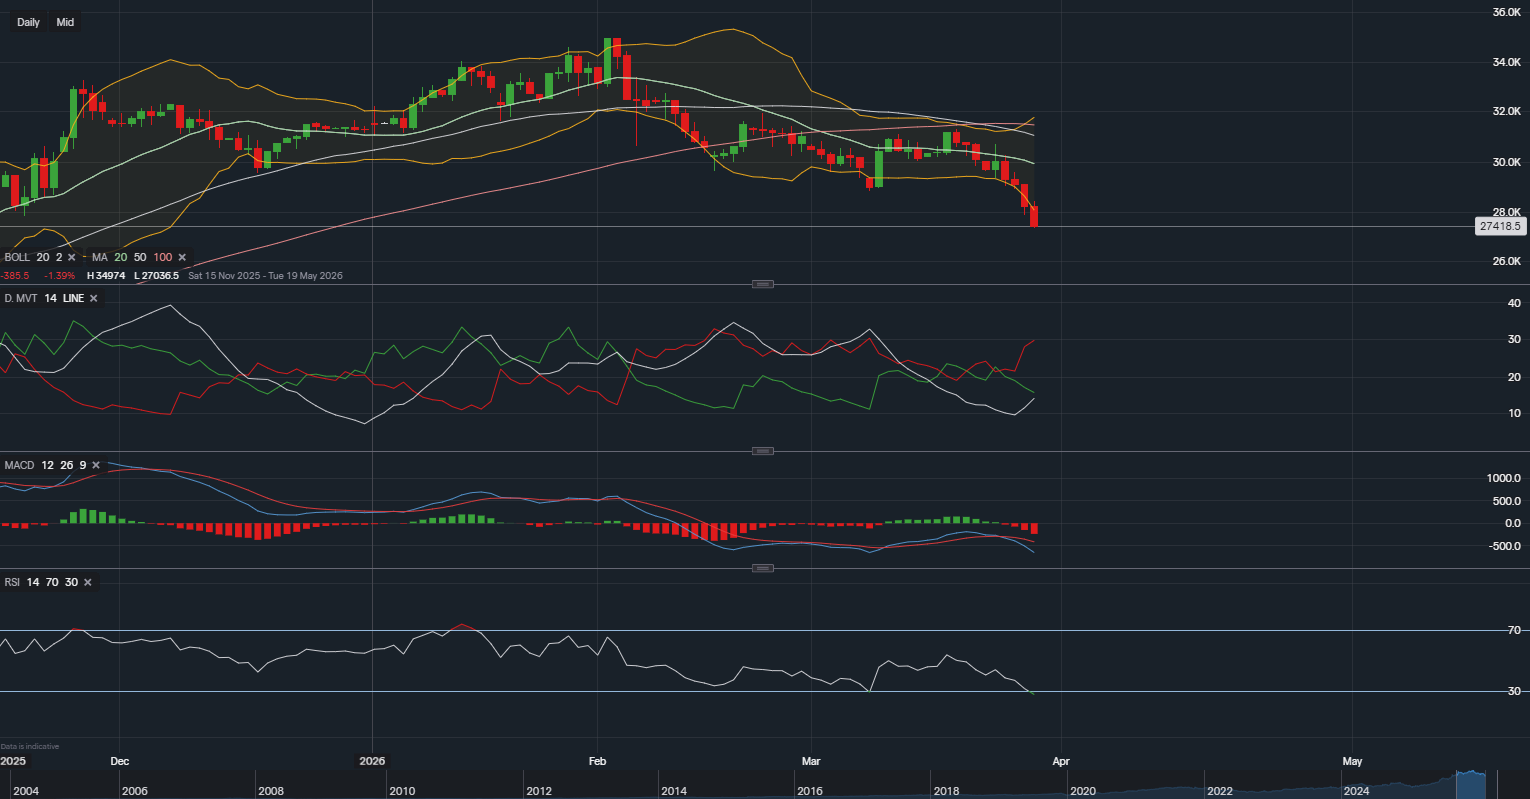
Recent Price Action: Consolidation After Prolonged Pressure
Amazon.com Inc shares have spent the past six months consolidating after a period of underperformance relative to other mega-cap technology stocks. This phase has been marked by repeated pullbacks into oversold territory, followed by measured recoveries, suggesting that selling pressure has gradually been absorbed rather than accelerating lower.
As earnings approach, price action increasingly resembles a base-building phase, with volatility compressing and downside momentum weakening. This often precedes a directional move, particularly when combined with a strong fundamental catalyst.
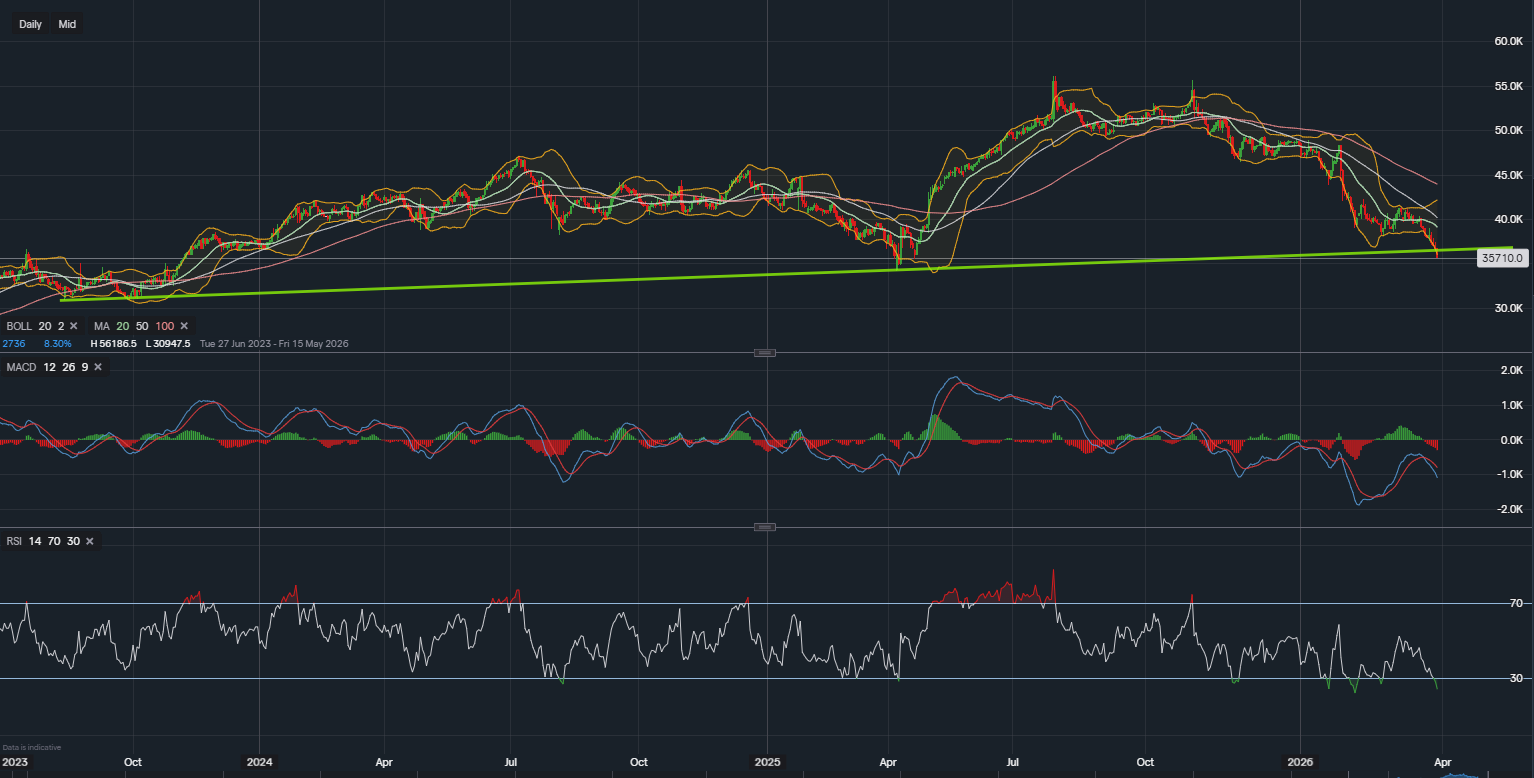
Technical Analysis: RSI Reset Signals Breakout Potential
From a technical perspective, Amazon’s current setup is constructive. The Relative Strength Index sits at 48, placing the stock firmly in neutral territory and providing ample room for upside without immediately triggering overbought conditions.
Importantly, Amazon has spent much of the past six months dipping into oversold RSI levels, indicating persistent selling pressure that now appears to be fading. The current RSI reset suggests momentum is stabilising, which historically has positioned the stock well for upside moves following earnings. This pattern is reinforced by Amazon’s track record of beating earnings expectations in each of the last four quarters, often followed by positive post-earnings price reactions.
Support and Resistance Levels: Key Price Zones
Amazon’s chart structure highlights several technically significant levels that traders and investors should be watching closely.
On the downside, $225–$228 remains the most important near-term support zone, having repeatedly attracted buyers during recent pullbacks. A deeper support level sits around $210, which represents a longer-term accumulation area and would likely require a material deterioration in sentiment to be tested.
On the upside, $250 stands out as the first major resistance level. This is both a psychological barrier and a prior rejection zone. A sustained break above this level could open the path towards $268–$270, a former swing high and key technical confirmation level. Beyond that, the $300 area aligns closely with long-term analyst price targets.
Fundamental Analysis: Valuation Supports Further Upside
Fundamentally, Amazon’s valuation continues to support the bullish case. The current P/E ratio of 33.71 is only modestly above the company’s historical average of 31.86, while the forward P/E of 30 points to expectations of accelerating earnings growth.
When Amazon’s $2.55 trillion market capitalisation is divided by its forward P/E, the implied future profit forecast of approximately $85 billion highlights the company’s earnings power. This level of profitability provides a strong foundation for higher share prices over time, particularly if margins continue to expand across cloud and retail operations.
Analyst Sentiment: Strong Conviction Ahead of Earnings
Analyst sentiment around Amazon is overwhelmingly positive heading into earnings. With 35 out of 36 analysts rating the stock a Strong Buy, conviction is unusually high. The average price target of $298.53 implies upside of just over 25% from current levels, while TipRanks’ 9 out of 10 score suggests a strong probability of market outperformance.
Such alignment ahead of earnings typically reflects confidence in both near-term results and forward guidance.
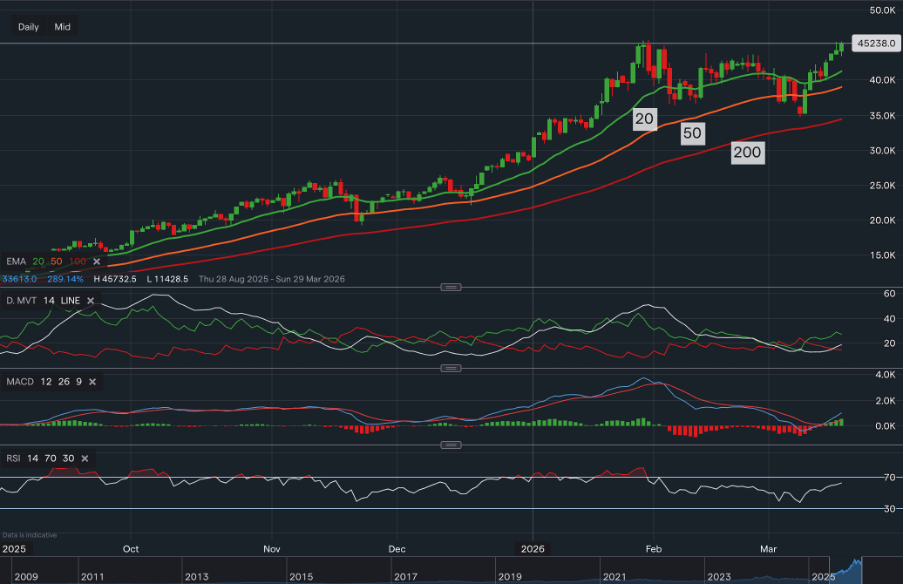
Outlook for Traders and Investors
Amazon appears to be approaching a technical and fundamental inflection point. Momentum indicators have reset, valuation remains supportive, and earnings consistency provides a credible catalyst for renewed upside.
For traders, a strong earnings report could trigger a breakout above key resistance levels. For longer-term investors, the combination of earnings power, analyst conviction and improving technical structure continues to offer an attractive risk-reward profile.
If earnings once again exceed expectations, a sustained move towards the $270–$300 range becomes increasingly plausible.

Tradable assets:
Min.Deposit:
Max Leverage:
FCA:

Rating:


 Earnings Calendar
  Economic Calendar
  VAT Calculator
  Tax Free Childcare Calculator
 Percentage Calculator
 Compound Interest Calculator
  Loan Overpayment Calculator
 Mortgage Calculator
 Credit Card Calculator
 Investing
  Economics
 Trading
  Technical Analysis
  Personal Finance
 Calculator