Micron Technology Stock Analysis: AI Memory Demand Drives Growth
$452.38
17 Mar 2026, 14:53
Neutral

Join Minipip Academy and access free courses in investing, trading, economics, and more.
Sign Up
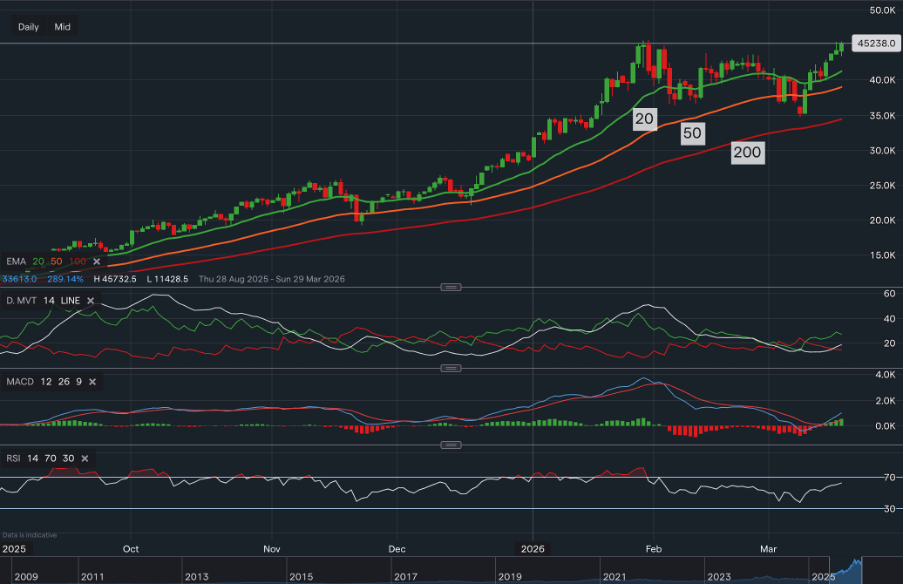
Data from IG - TimeFrame - Daily
Market Overview
Autodesk continues to operate as a premium-valued technology stock, reflected in its current P/E ratio of 60.29 and a forward P/E of 25.69. Although these figures place it on the higher end of the valuation spectrum, they often indicate that the market is pricing in long-term growth rather than short-term performance. This naturally positions Autodesk as a company that growth-focused investors tend to monitor closely, especially during periods of technical weakness that may offer future opportunity. Analyst sentiment from TipRanks reinforces this perspective, as the stock maintains a ratings score of 24 with the majority favouring a strong buy outlook, suggesting that confidence remains firm around Autodesk’s longer-term potential.
Technical Structure and Price Behaviour
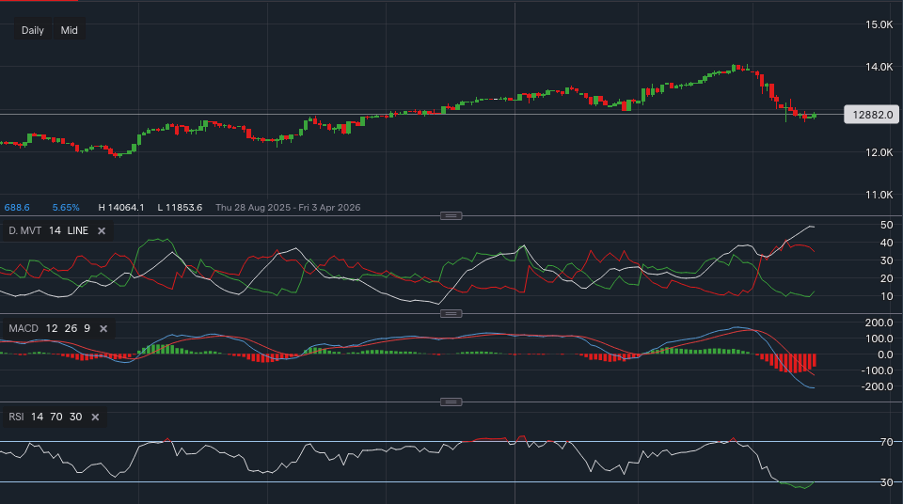
On the daily timeframe, Autodesk is currently presenting a structure that strongly resembles previous corrective sequences, signalling a potential historical repeat in its price behaviour. Each major pullback in the past has followed a recognisable rhythm: an initial sharp drop from a swing high, a temporary breakdown beneath the Ichimoku Cloud, a retest of long-term rising support, and a gradual recovery as buyers return. The highlighted areas in your chart visually capture these repeating cycles, where red momentum spikes lead into consolidation phases followed by a slow regain of structure.
The current pattern fits this same progression. Price has once again reacted sharply from recent highs and moved back toward the long-term ascending trendline, which has served as a reliable support area across multiple corrections. Even though the cloud dynamics indicate temporary uncertainty, Autodesk’s behaviour around this trendline has historically marked the transition from weakness into stabilisation. As price begins interacting with this familiar zone once more, it reflects the same cyclical rhythm that has been a consistent feature of its broader uptrend.
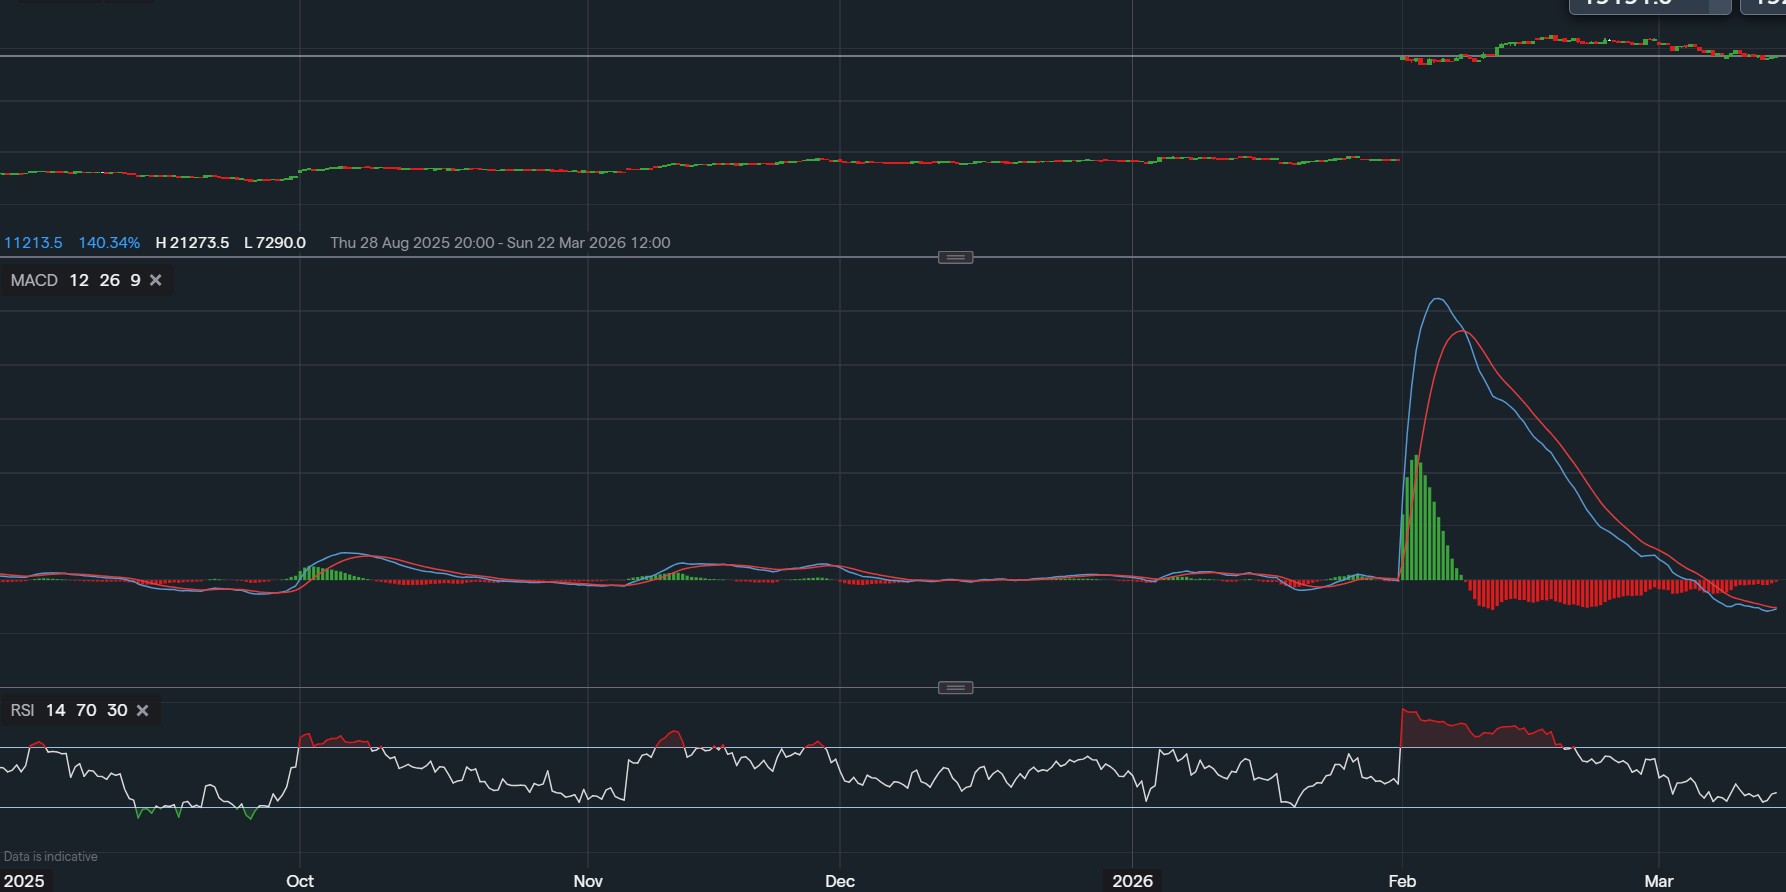
Relative Strength Index
The Relative Strength Index is neutral and hovering around mid-range levels, neither oversold nor overbought. In previous cycles, Autodesk’s strongest recoveries developed when the RSI settled into this same stabilised region after downward pressure eased. While the RSI does not provide a signal in isolation, its position aligns with the current pattern repeat, showing that downward momentum has cooled and the market is transitioning into a more balanced state.
Conclusion
Autodesk’s daily chart continues to show a characteristically repetitive structure, where corrective phases mirror past movements before gradually shifting back into trend. The long-term rising support line remains a central element of this pattern, and price behaviour is once again respecting that historical level. Combined with elevated valuation metrics that reflect long-term investor confidence and strong analyst sentiment from TipRanks, the technical landscape presents a scenario that may be worth watching as the market decides its next direction. While no technical pattern guarantees future outcomes, Autodesk’s consistency in these repetitive structures offers a useful framework for assessing its current position.
Disclaimer
This analysis is for informational purposes only and should not be considered financial advice. Investors and traders should conduct their own research and consider individual risk tolerance before making any investment decisions.

Tradable assets:
Min.Deposit:
Max Leverage:
FCA:

Rating:


 Earnings Calendar
  Economic Calendar
  VAT Calculator
  Tax Free Childcare Calculator
 Percentage Calculator
 Compound Interest Calculator
  Loan Overpayment Calculator
 Mortgage Calculator
 Credit Card Calculator
 Investing
  Economics
 Trading
  Technical Analysis
  Personal Finance
 Calculator