Micron Technology Stock Analysis: AI Memory Demand Drives Growth
$452.38
17 Mar 2026, 14:53
Neutral

Join Minipip Academy and access free courses in investing, trading, economics, and more.
Sign Up
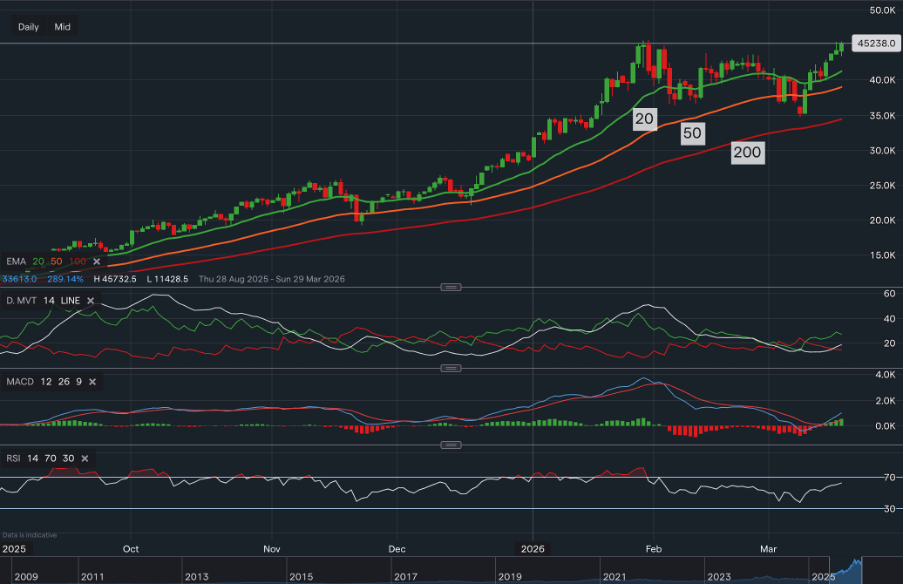
Data From IG - Timeframe - 4HR
Market Overview
Dell is positioned at a compelling point from both a valuation and technical perspective. With a current P/E ratio of 18.02 and a forward P/E of 10.92, the company is priced in a way that suggests expectations of profit improvement over the coming twelve months. This discrepancy between present and forward valuations often reflects anticipated earnings growth, giving the stock an appealing fundamental backdrop. Analyst sentiment on TipRanks adds further confidence, as the majority of analysts have assigned buy ratings, aligning the broader market outlook with the possibility of longer-term upside potential.
Market Structure Outlook
On the 4-hour timeframe, Dell has developed a clear stabilisation zone around $120.00, which is acting as the structural foundation of the current price action. This level has served as an important reaction area historically and is once again functioning as the major support zone preventing additional downward movement. Recent candles show repeated attempts by the market to reject prices beneath this level, suggesting diminishing selling pressure and a shift toward foundational support building.
The stock has descended from its highs in a steep and controlled decline, but the emerging pattern of consolidation around $122.51–$120.00 signals that the aggressive selling phase may be transitioning into a period where buyers gradually regain influence.
Emerging Reversal Potential
A series of early reversal signs are beginning to align. The parabolic SAR, which had consistently printed above the price during the downtrend, is now tightening and preparing to shift, highlighting a loss of bearish strength. The price structure is compressing near support, and candle behaviour—marked by shorter bodies and lower wick rejections reflects hesitation from sellers.
This often occurs when downside momentum becomes exhausted and the market reaches a historically favourable level for accumulation. The support zone around $120.00 appears to be a major deciding area where buyers are stepping forward to absorb pressure. These developments, while early, create the groundwork for a potential corrective move back toward previous breakdown levels.
Stochastic Momentum Confirmation
The stochastic oscillator’s upward lift from oversold conditions provides an additional layer of confirmation. Both lines have turned higher decisively, signalling that bullish momentum is strengthening at the same time the price is defending major support. This indicator movement is characteristic of early recovery phases or short-term relief rallies, especially within broader corrective structures.
When the stochastic rises while Dell consolidates above $120.00, the probability of a rebound increases, particularly toward the next structural price zones.
Resistance Levels and Recovery Targets
The green price lines above the market highlight the key resistance levels Dell may migrate toward if the emerging reversal continues to develop. These include:
$130.00, acting as the closest resistance and the first meaningful checkpoint where the stock may pause or react.
Further above, broader recovery targets sit near $140.00, $150.00, and eventually $170.00, which all represent former reaction zones created during the earlier bullish phase of the chart. These areas have historically responded as strong pivot points, making them the most technically relevant upside levels should a sustained recovery unfold.
Given the combination of rising stochastic momentum, stabilised price action, and a softening parabolic SAR structure, Dell appears to be in a position where a corrective pullback toward these resistance zones becomes increasingly possible if the support at $120.00 continues to hold.
Conclusion
Dell presents an attractive blend of fundamental potential and emerging technical strength. The stock is stabilising around a key support zone near $120.00, while momentum indicators and structural behaviour are beginning to tilt in favour of a short-term recovery. Coupled with a forward P/E that indicates anticipated earnings growth and strong analyst confidence from TipRanks, the overall landscape suggests that Dell may be preparing for an upward pullback toward the outlined resistance levels. While the broader trend remains corrective, the present signals highlight improving prospects for a rebound as long as buyers continue to defend the current support.
Disclaimer
This analysis is for informational purposes only and should not be considered financial advice. Investors and traders should conduct their own research and consider individual risk tolerance before making any investment decisions.

Tradable assets:
Min.Deposit:
Max Leverage:
FCA:

Rating:


 Earnings Calendar
  Economic Calendar
  VAT Calculator
  Tax Free Childcare Calculator
 Percentage Calculator
 Compound Interest Calculator
  Loan Overpayment Calculator
 Mortgage Calculator
 Credit Card Calculator
 Investing
  Economics
 Trading
  Technical Analysis
  Personal Finance
 Calculator