Visa Stock Analysis: Is Visa a Strong Opportunity Ahead of Q4 Earnings?
$325.48
28 Jan 2026, 19:25
Bullish
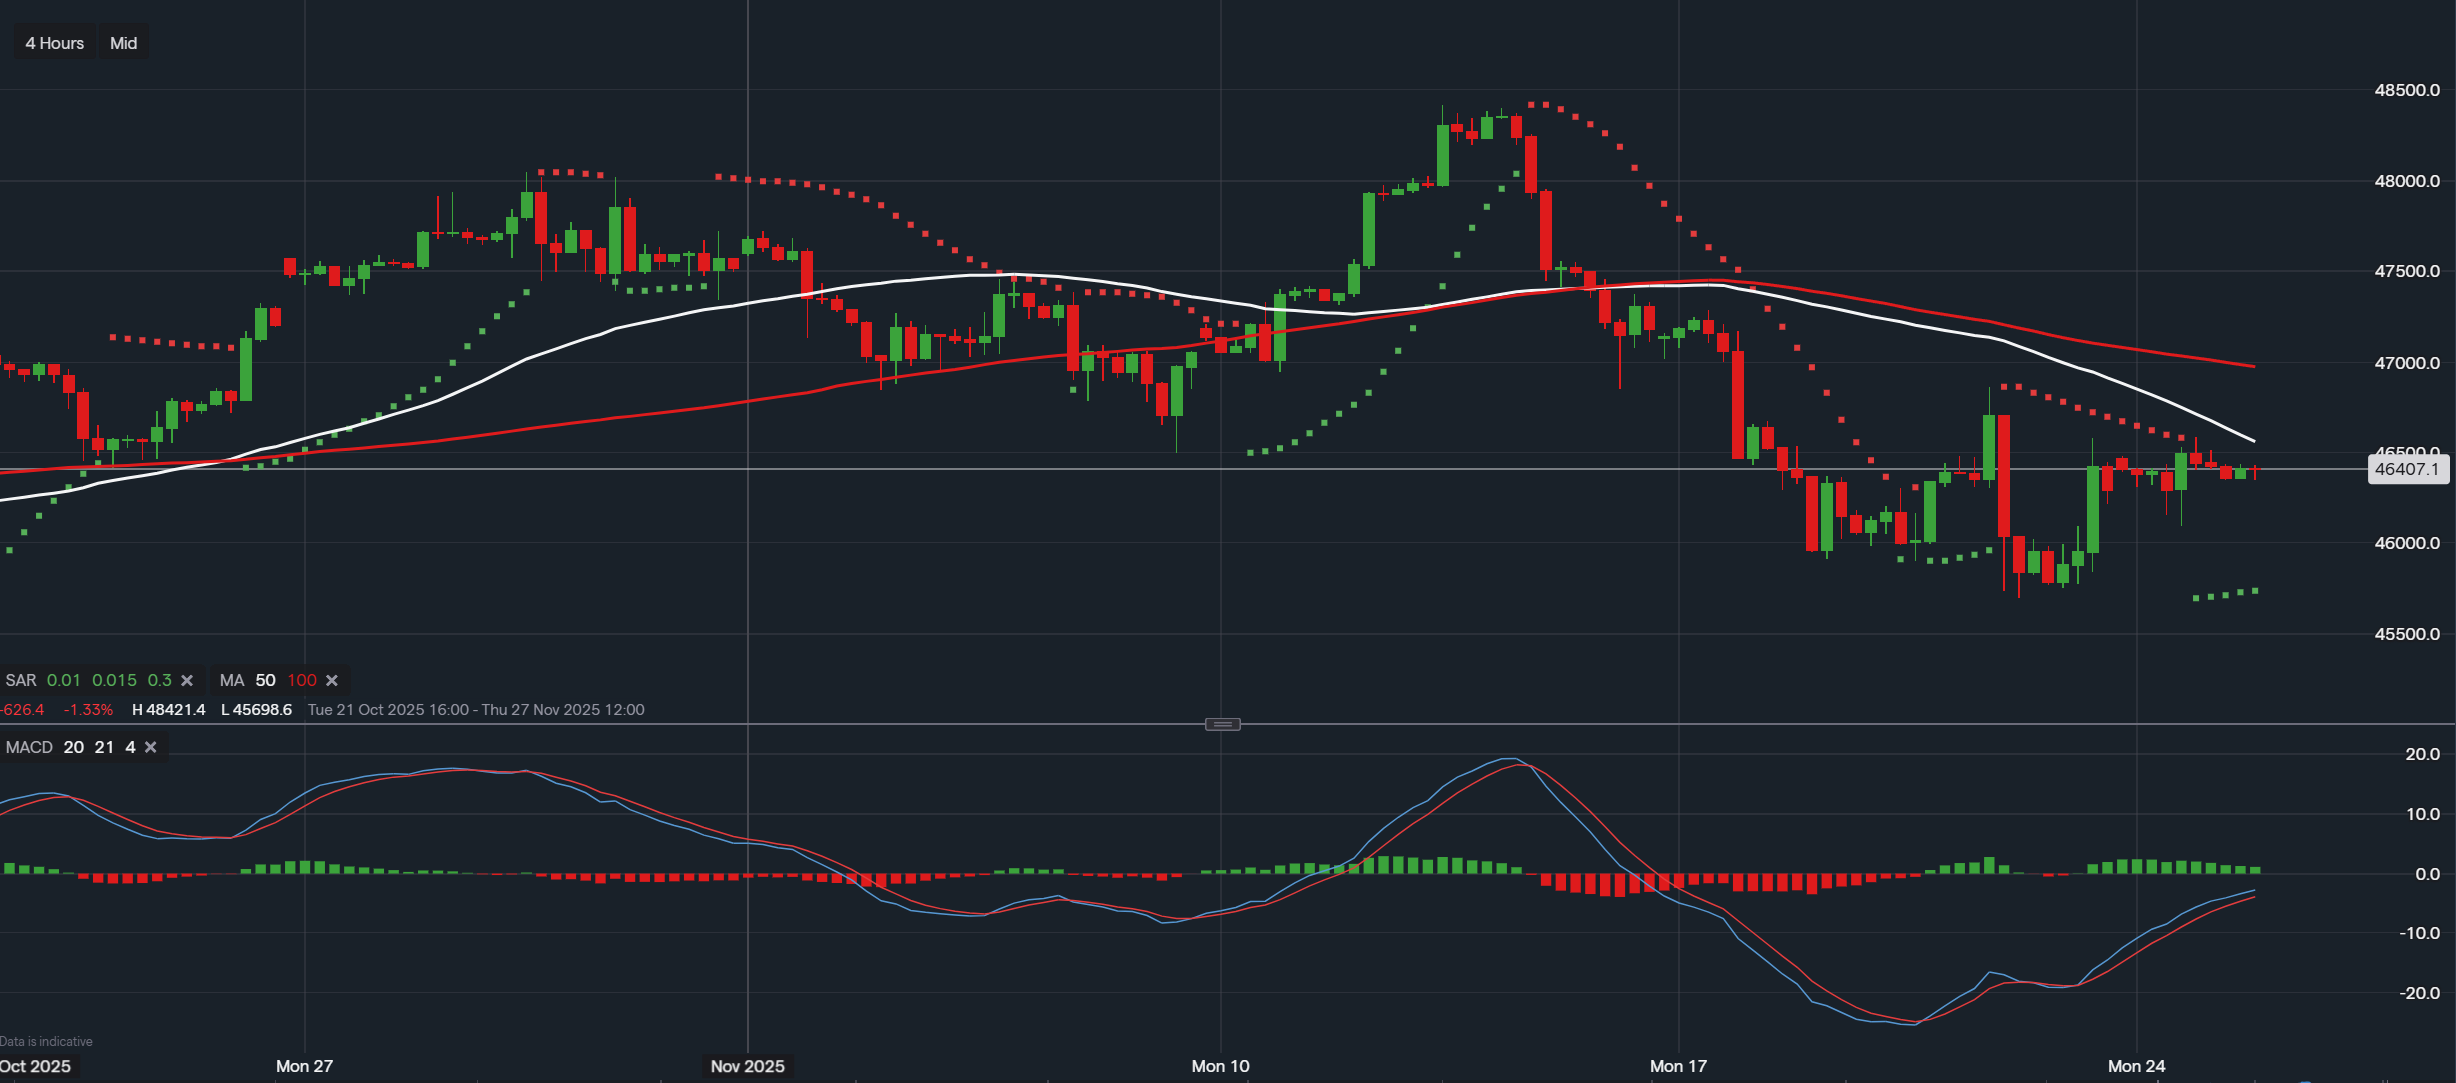
Data from IG - Timeframe - 4H
Market Overview
The Dow Jones Industrial Average (DJIA) is currently experiencing a brief pullback on the 4-hour timeframe, characterized by a consolidation phase amid recent downward pressure. The index has declined from approximately 48,500 to around 46,400, reflecting short-term bearish sentiment. However, signs of potential buyer resurgence are emerging, as indicated by key technical indicators. This pullback appears to be a corrective move within a broader uptrend, but sustained momentum will be crucial to avoid further downside.
Technical Indicators Analysis
The 50-period Simple Moving Average (SMA) is positioned below the 100-period SMA, confirming the recent bearish crossover and signaling short-term weakness. This alignment suggests sellers have maintained control in the near term, contributing to the ongoing consolidation. However, the price remains above both averages in spots, hinting at underlying support levels that could limit further declines.
The Parabolic SAR dots are currently plotted below the price candles, indicating that the immediate trend bias remains bullish. This placement reflects attempts by buyers to regain control and push prices higher, potentially countering the pullback. A shift of the SAR dots above the price would signal a reversal to bearish momentum, which could accelerate downside movement.
The MACD line is positioned above the signal line, accompanied by a positive histogram, which denotes modest bullish momentum building. This crossover suggests early signs of buyer interest, aligning with the Parabolic SAR's supportive stance. However, the histogram bars are narrowing, indicating waning momentum that could lead to a bearish crossover if selling pressure intensifies.
Trading volume has shown mixed signals, with recent bars displaying a combination of red (selling) and green (buying) activity. The price is consolidating in a tight range near 46,400–46,700, forming a potential support zone. Candlestick patterns reveal increased volatility, with alternating bullish and bearish candles, underscoring indecision among market participants.
Potential Trading Scenarios
If buyers sustain momentum, a breakout above the recent high near 47,000 could invalidate the pullback, targeting resistance at 48,000–48,500. This scenario would be supported by the MACD maintaining its bullish crossover and the Parabolic SAR remaining below price, potentially driven by positive macroeconomic data or risk-on sentiment. Conversely, traders should monitor for a further drop if the Parabolic SAR flips above the consolidating price zone, which might coincide with a MACD bearish crossover. This could push the index toward lower support levels around 45,500–46,000, exacerbating the pullback into a deeper correction.
Conclusion
Overall, the DJIA’s 4-hour chart reflects a short-term pullback characterized by mixed technical signals: a bearish moving-average crossover contrasts with early signs of bullish momentum from the MACD and Parabolic SAR. This period of consolidation leaves room for a potential rebound if buyers regain control, though a decisive break below key support levels could open the door to further downside. At present, the index appears finely balanced, suggesting that a cautious, wait-and-see approach is warranted until clearer directional signals emerge ideally supported by broader economic data and meaningful market catalysts.
Disclaimer
This analysis is for informational purposes only and should not be considered financial advice. Investors and traders should conduct their own research and consider individual risk tolerance before making any investment decisions.

Tradable assets:
Min.Deposit:
Max Leverage:
FCA:

Rating:


 Earnings Calendar
  Economic Calendar
  VAT Calculator
  Tax Free Childcare Calculator
 Percentage Calculator
 Compound Interest Calculator
  Loan Overpayment Calculator
 Mortgage Calculator
 Credit Card Calculator