General Dynamics (GD) Fundamental and Technical Stock Analysis: Can the Defence Prime Keep Outperforming?
$364.70
04 Mar 2026, 12:54
Neutral

Join Minipip Academy and access free courses in investing, trading, economics, and more.
Sign Up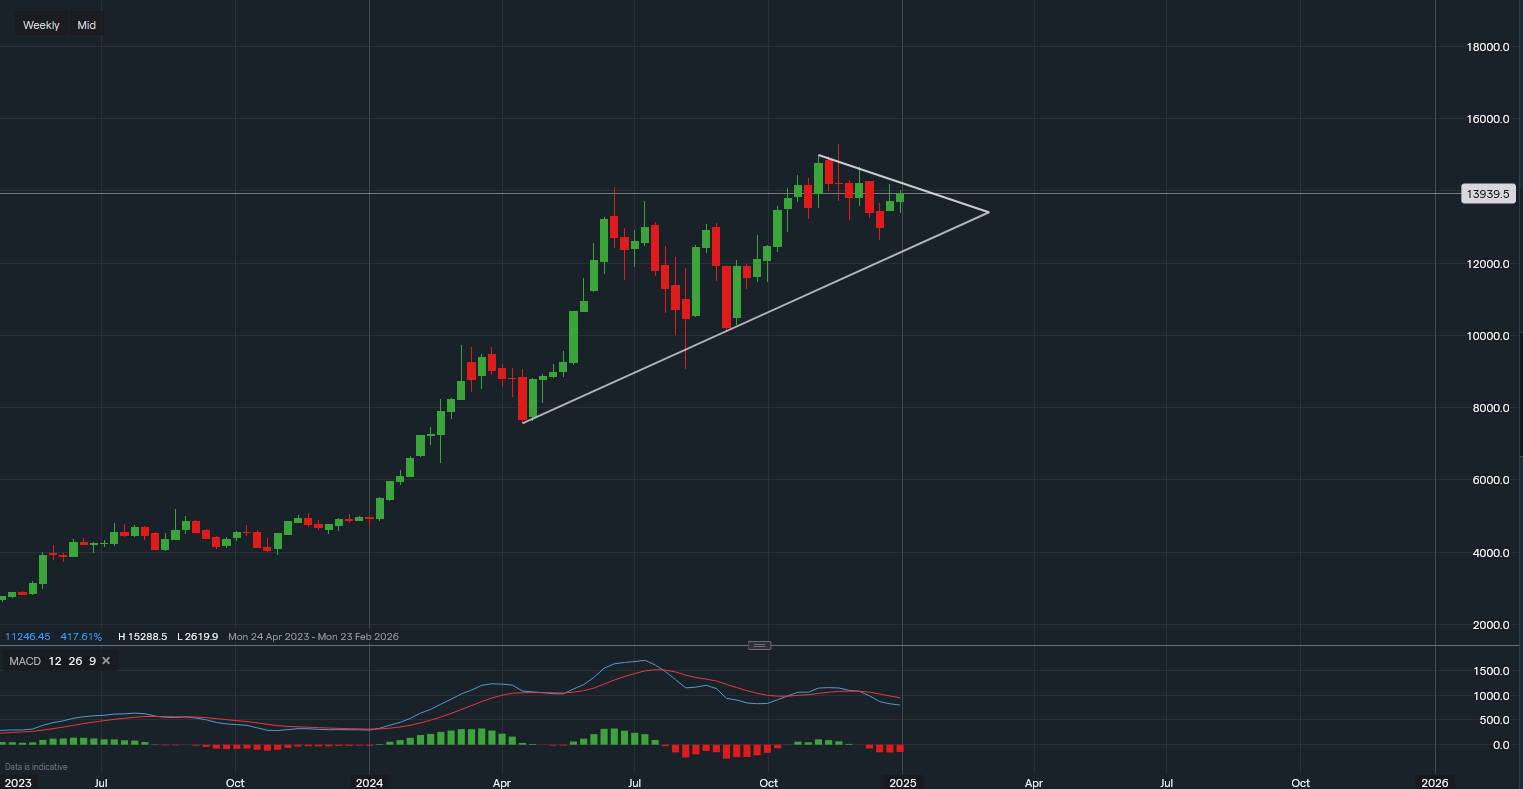
Chart & Data from IG
These 'Top Picks' are in no particular order and this article should not be taken as a signal to buy. This is simply Minipip's Stock Market Insights and Opinion. *All Investments Carry Risk and are at Own Discretion*.
1. Nvidia
Nvidia's shares are currently trading around $139.39 per share, reflecting a 13% decline from recent highs during November and December. Despite this pullback, Wall Street analysts remain optimistic about the AI leader, with an average price target of $177 per share (according to TipRanks data). Here's a closer look at the key technical and momentum factors influencing Nvidia's stock trajectory in the coming weeks.
Key Resistance Levels to Watch
On the weekly chart, Nvidia's focus lies around the $142 resistance level, which aligns with the upper trendline of a wedge pattern. A breakout above this trendline could signal a resurgence of bullish momentum. However, further resistance awaits between $150 and $152, a critical zone that the stock must overcome for sustained upward movement.
Support Levels and Downside Risks
On the downside, immediate support can be found at $133.84. If Nvidia's share price falls below this level, the next focus would shift to $126.51, which marked the December low. A break below $126.51 could trigger a deeper sell-off, posing a significant risk for investors.
Momentum Indicators Suggest Caution
From a momentum perspective, the MACD (Moving Average Convergence Divergence) indicator has turned negative, suggesting potential near-term downside pressure. This mirrors a scenario seen in July and August when Nvidia experienced a volatile trading period before eventually rebounding to fresh highs in October.
While the current MACD trend warrants caution, it's worth noting that similar setups in the past were followed by recoveries, driven by Nvidia's strong fundamentals and market position in AI technology.
What’s Next for Nvidia?
Investors should closely monitor the $142 resistance level and the MACD momentum trend for signs of a potential turnaround. Breakouts above critical levels such as $150-$152 could pave the way for significant gains, while a breach of $126.51 would signal the need for greater caution.
Meta’s stock is currently trading around $603.71 per share, with analysts at Mizuho predicting it could climb to $700 within the next 6-12 months. This projection suggests a potential upside of 16% from the current price. Here’s a detailed analysis of the technical and momentum factors influencing Meta’s stock trajectory.
Technical Analysis: Key Support and Resistance Levels
Meta’s share price has been trading within a defined channel pattern since May, with the lower trendline providing consistent support. After a recent 7-8% pullback in December, the stock is once again near this lower trendline, which could attract buyers seeking to capitalise on a potential rebound.
Momentum Indicators Signal Consolidation
The MACD (Moving Average Convergence Divergence) provides additional insights into Meta’s momentum:
Analyst Optimism and Future Prospects
Meta’s strong fundamentals, coupled with its long-term growth in AI, virtual reality, and advertising, underpin Mizuho’s bullish outlook. A price target of $700 reflects confidence in the company’s ability to maintain its competitive edge in these evolving markets.
What’s Next for Meta Stock?
Investors should watch the $609.15 resistance level closely, as a breakout here may confirm renewed bullish momentum. Additionally, monitoring the MACD for a potential crossover above the signal line will provide further confirmation of strength.

(Chart & Data from IG)
Microsoft, a cornerstone of Mizuho’s "must-own stocks" for 2025, is currently trading around $419.88 per share. While the tech giant’s leadership in AI, cloud computing, cybersecurity, and other sectors remains unmatched, recent price action and technical indicators suggest a challenging near-term outlook. Here’s an in-depth analysis of Microsoft’s key support, resistance levels, and momentum factors for the year ahead.
Technical Analysis: Resistance and Support Zones
Downside Risks and Near-Term Outlook
A lower high of $456 has now been established, and the white trendline is expected to act as technical resistance throughout Q1 of 2025. Breaking above this trendline is essential for restoring investor confidence and unlocking greater upside potential. Failure to do so may result in continued underperformance, especially relative to the S&P 500 index tracker, where Microsoft lagged in 2024.
Long-Term Potential Amid Short-Term Challenges
Despite near-term hurdles, Microsoft’s fundamentals remain robust. Its leadership in AI-driven innovation, expansive cloud services, and cutting-edge cybersecurity solutions positions the company as a dominant force in the tech sector. For long-term investors, these strengths provide a strong foundation for sustained growth beyond 2025.
Key Indicators to Monitor

(Chart & Data from IG)
Marvell Technology is a standout name on Mizuho’s "must-own stocks" list for 2025. After an impressive 85% gain in 2024, Marvell’s stock is currently trading at $115.53 per share, cementing its position as a high-performing tech player. Here's an analysis of the stock’s technical indicators and key levels to watch in the coming months.
Breaking Records and Facing Resistance
Marvell surged past its previous all-time high of $93.85 in late 2024, but the stock is now encountering resistance at around $126.13. This marks a crucial level for traders and investors looking to assess the stock’s next potential breakout.
Momentum Indicators: Bullish But Cautious
Investors should remain cautious of potential profit-taking in January, which could temporarily cool the rally.
Support Levels to Watch
2025 Outlook: Higher Highs Ahead?
Marvell has been on a bullish trajectory since 2023, with a pattern of creating higher lows and higher highs. This trend could persist if the stock consolidates at support levels and regains upward momentum. Investors looking to add Marvell to their portfolios should monitor RSI levels closely and look for signs of a breakout above $126.13, which could pave the way for another leg up.

(Chart & Data from IG)
(Some Data sourced from investing.com. Analysis created by Minipip)

Tradable assets:
Min.Deposit:
Max Leverage:
FCA:

Rating:


 Earnings Calendar
  Economic Calendar
  VAT Calculator
  Tax Free Childcare Calculator
 Percentage Calculator
 Compound Interest Calculator
  Loan Overpayment Calculator
 Mortgage Calculator
 Credit Card Calculator
 Investing
  Economics
 Trading
  Technical Analysis
  Personal Finance
 Calculator


