Visa Stock Analysis: Is Visa a Strong Opportunity Ahead of Q4 Earnings?
$325.48
28 Jan 2026, 19:25
Bullish
Data From IG - Timeframe - Daily
Market Overview
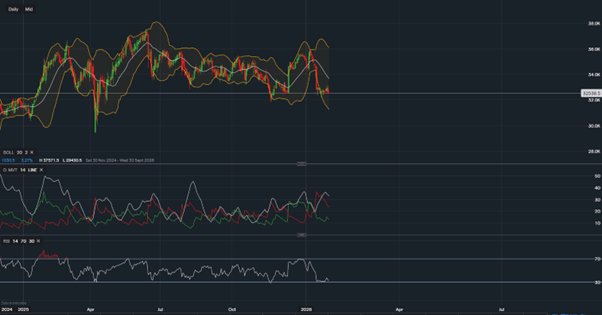
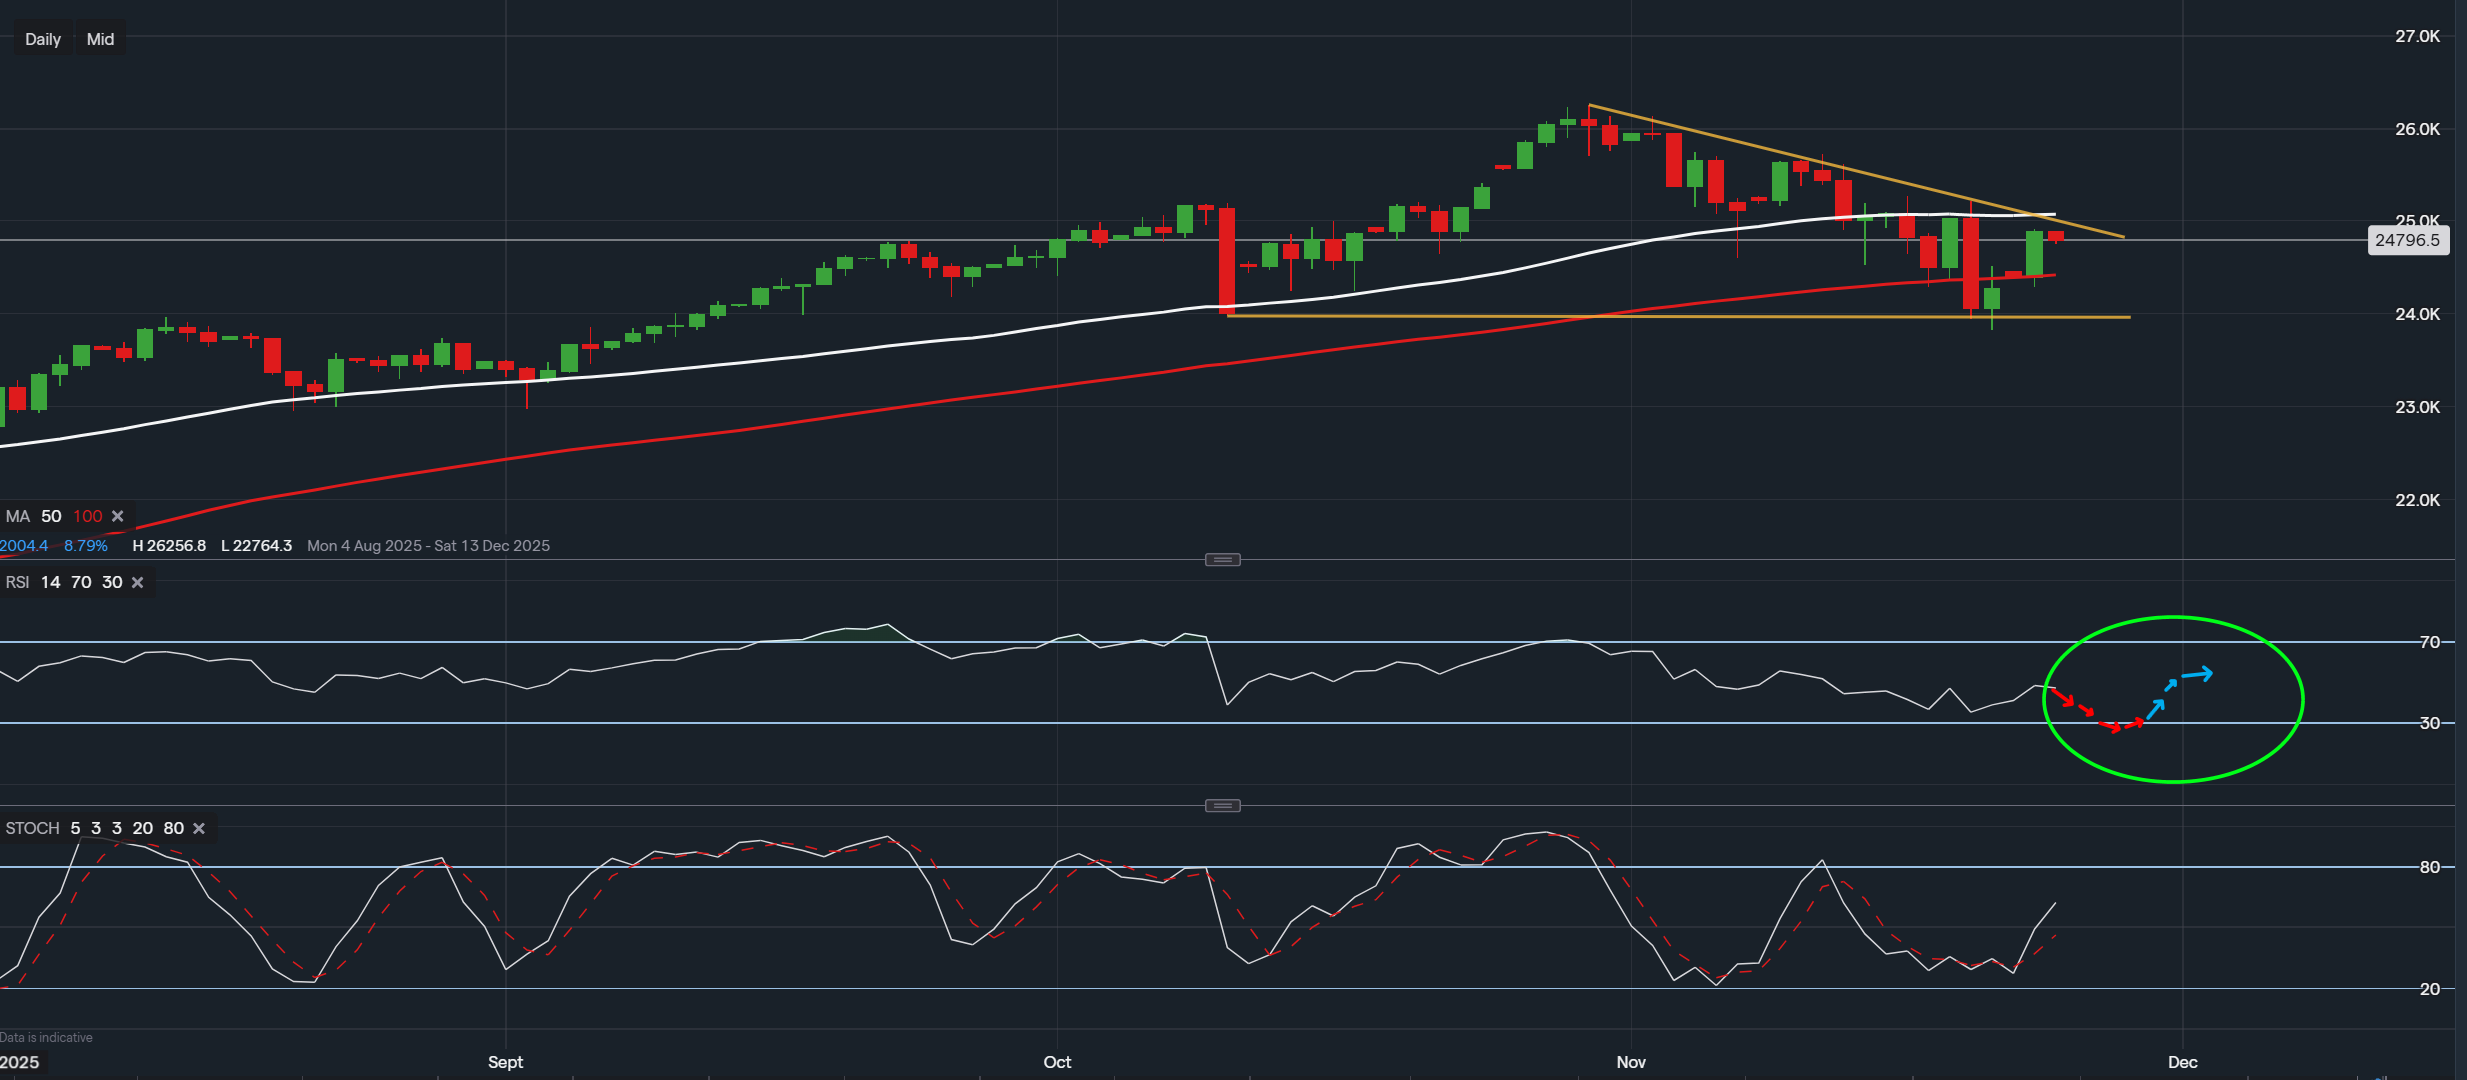
The Nasdaq Composite Index has recently experienced a period of corrective movement, shaped by broader shifts in market sentiment, ongoing macroeconomic uncertainty, and sector rotations within technology. While the index has faced selling pressure, longer-term structures remain intact, and volatility has moderated compared with earlier in the quarter. This stabilizing behavior suggests that market participants may be reassessing risk rather than fully exiting positions, positioning the index at an important technical area that could influence future price direction.
Technical Analysis
On the daily timeframe, the Nasdaq Composite is forming a well-defined falling wedge pattern. This structure, characterized by converging downward-sloping trendlines, often reflects a loss of bearish momentum and can potentially precede a reversal if confirmed. Price action has compressed between roughly 26,200 on the upper boundary and 22,700 on the lower boundary over the past several months.
Moving Averages Offering Context, Not Guarantees
The index remains above the 100-day moving average, which has so far acted as an area of potential dynamic support around the 23,000 level. The 50-day moving average sits overhead near 24,500, serving as an area of potential resistance and helping define the wedge structure. These moving averages do not predict direction but offer context for where price has reacted historically.
Momentum Indicators Highlighting Early Signs of Shift
The 14-period RSI is currently hovering near 40, suggesting that bearish momentum may be easing without entering oversold conditions. This could indicate stabilization rather than a confirmed turning point.
The Stochastic oscillator has recently crossed higher from oversold territory, which can sometimes align with early buying interest. However, such signals are not guaranteed and should be viewed as part of a broader analytical framework.
Conclusion
The Nasdaq Composite is approaching a technically significant zone as the falling wedge pattern matures. If the index manages to break above the 25,000–25,200 region with convincing momentum, this could potentially signal a bullish reversal and open the way toward higher levels such as the 27,000 area.
Conversely, a decisive move below the wedge’s lower trendline would potentially invalidate the pattern and suggest that bearish continuation remains in play.
Overall, the chart suggests a period of potential opportunity depending on how the index reacts to these key technical boundaries. These observations are solely analytical and do not constitute financial advice; traders and investors should consider their own risk tolerance and independent research before making any decisions.
Disclaimer
This analysis is for informational purposes only and should not be considered financial advice. Investors and traders should conduct their own research and consider individual risk tolerance before making any investment decisions.

Tradable assets:
Min.Deposit:
Max Leverage:
FCA:

Rating:


 Earnings Calendar
  Economic Calendar
  VAT Calculator
  Tax Free Childcare Calculator
 Percentage Calculator
 Compound Interest Calculator
  Loan Overpayment Calculator
 Mortgage Calculator
 Credit Card Calculator