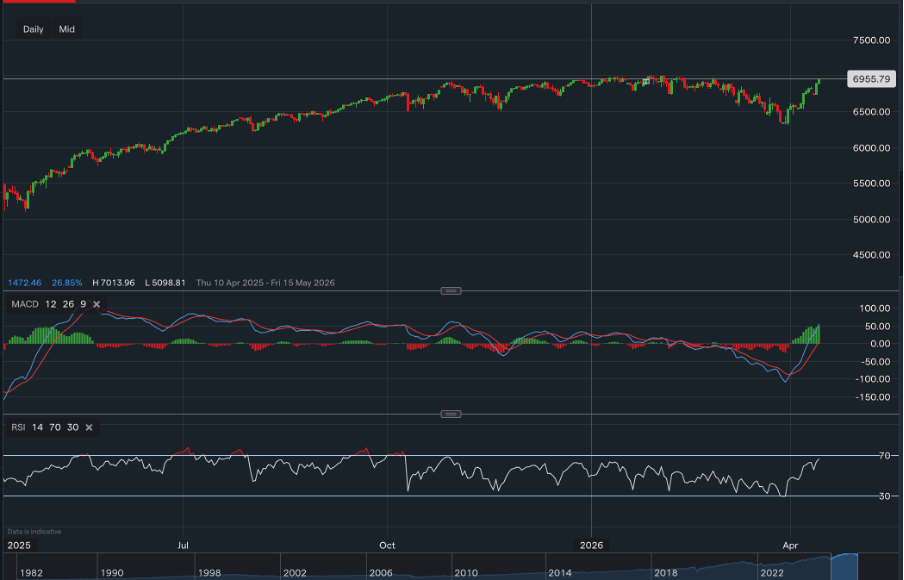
S&P 500 Analysis: Growth Strength Meets Macro Constraints
$6955.79 points
14 Apr 2026, 19:13
Neutral

Join Minipip Academy and access free courses in investing, trading, economics, and more.
Sign Up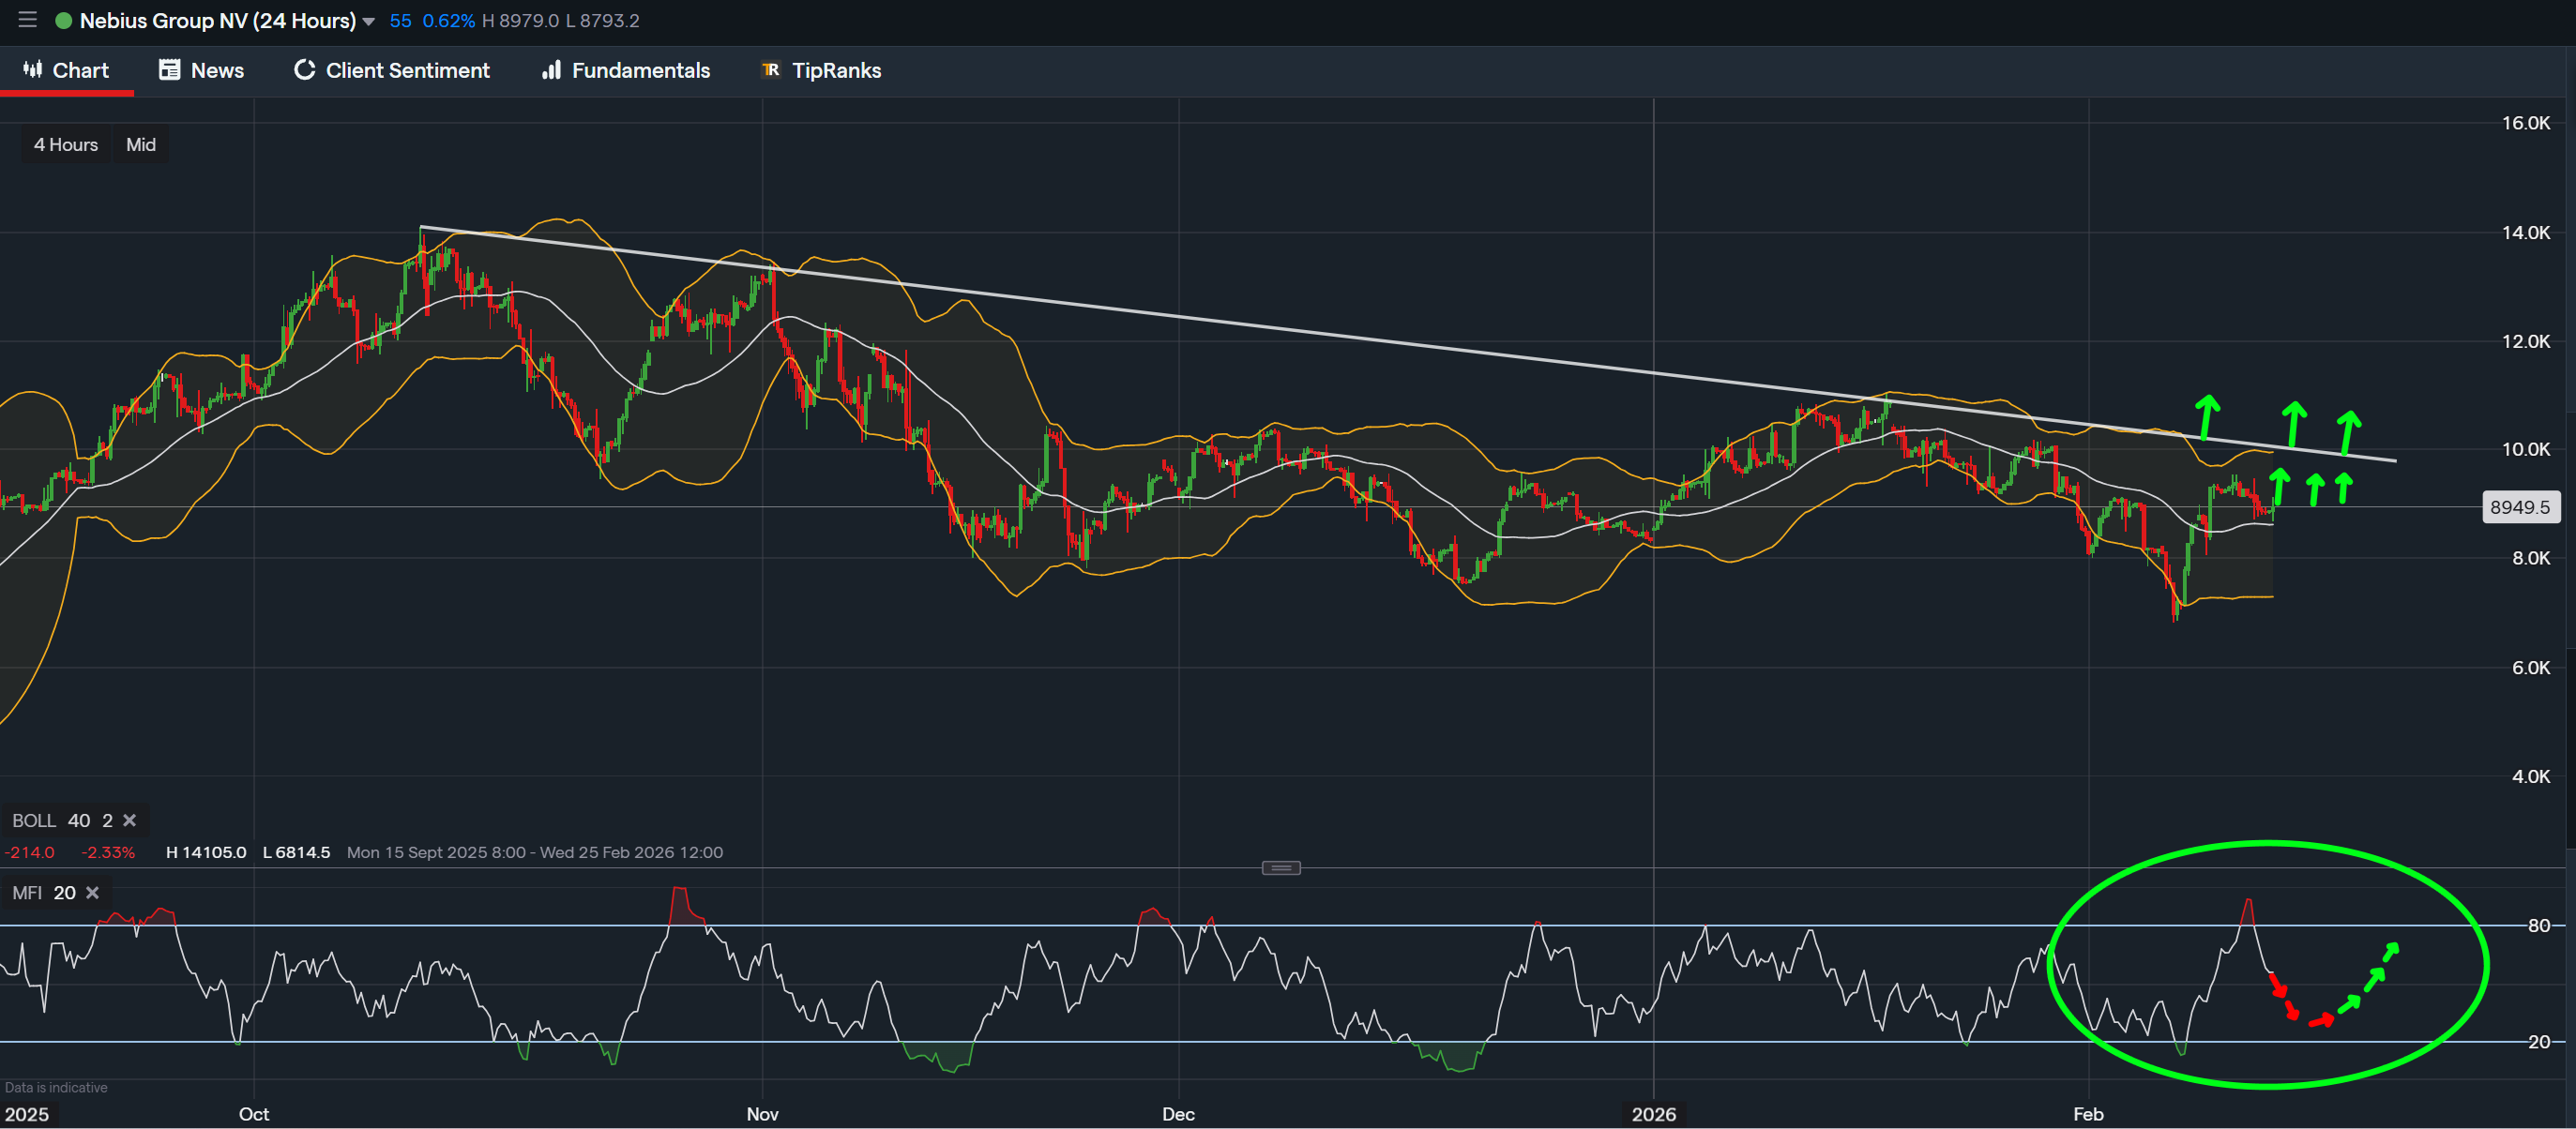
Data from IG - Timeframe - 4H
Market Overview
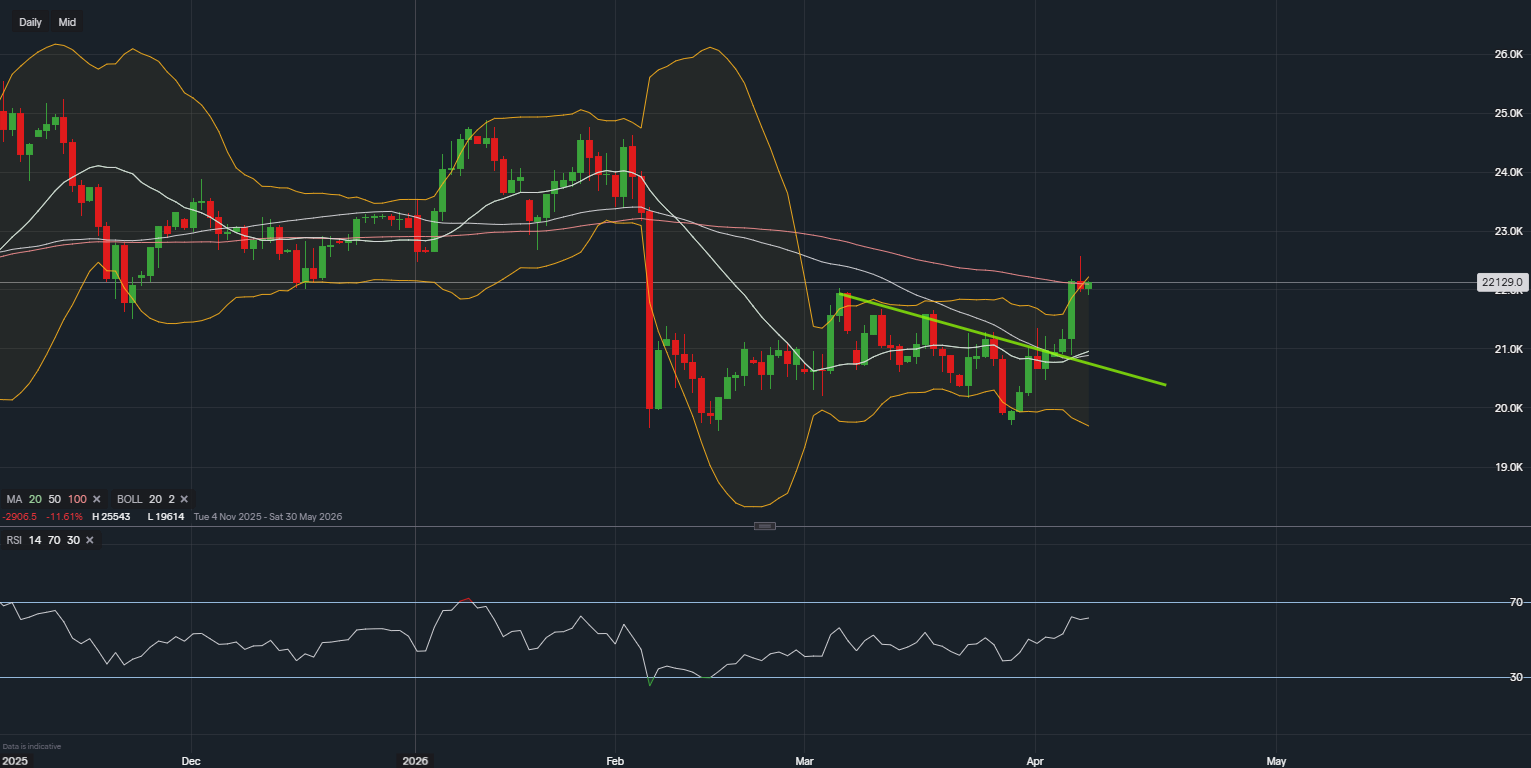
Nebius Group NV (NASDAQ: NBIS) stock is currently trading at 88.61 USD, with the 4-hour chart reflecting a period of technical compression beneath a broader descending resistance structure. Using Bollinger Bands (20,2) and the Money Flow Index (MFI 20), the current setup suggests volatility contraction following a corrective phase, with momentum stabilising after recent fluctuations.
On the 4-hour timeframe, Nebius Group stock remains positioned below a descending trendline that has capped rallies since prior highs above the 110–115 USD region. That falling resistance currently aligns near the 100–102 USD area and continues to define the broader corrective structure.
Following the recent decline toward the mid-70 USD zone, NBIS stock price rebounded and is now consolidating around 88.61 USD. The development of higher short-term lows suggests that immediate downside momentum has moderated. However, price remains beneath structural resistance, meaning the broader trend has not yet shifted.
At this stage, the technical profile reflects consolidation rather than confirmed reversal.
Bollinger Bands (20,2) – Volatility Compression Phase
The Bollinger Bands indicator on the 4-hour chart shows clear contraction after expanding during the prior sell-off. During the decline, price tracked along the lower band, signalling strong downside momentum. That expansion phase has since transitioned into narrowing bands as price oscillates around the mid-band (20-period moving average).
Bollinger Band compression typically reflects reduced volatility and market equilibrium. Historically, such narrowing phases precede directional expansion. However, the indicator itself does not predict direction, only the likelihood of increased volatility.
If price begins to close consistently outside the upper band while the bands widen, it would indicate strengthening upside volatility. Conversely, renewed expansion toward the lower band would reflect returning downside pressure.
At present, NBIS stock appears to be in a volatility compression phase rather than an active trend acceleration.
Money Flow Index (MFI 20) – Momentum and Capital Flow
The Money Flow Index (MFI) on the 4-hour chart recently reached overbought territory near the 80 level during the rebound phase. Since then, the MFI has retraced toward the mid-range (approximately 35–45), indicating a cooling of short-term inflows.
Importantly, the pullback in MFI has not extended into deeply oversold conditions below 20. This behaviour can reflect a momentum reset rather than aggressive distribution. In many technical structures, sustained trends often see oscillators reset to mid-range before attempting continuation.
Should the MFI rotate back above the 50 level while price maintains stability above recent higher lows, it would indicate strengthening internal momentum. Alternatively, a renewed move toward oversold territory could signal increasing downside pressure.
The current MFI positioning suggests neutral-to-stabilising momentum on the 4-hour timeframe.
Technical Outlook for Nebius Group Stock
With NBIS stock trading at 88.61 USD, the 4-hour chart reflects:
The technical structure is currently balanced between developing short-term support and persistent overhead supply. A decisive shift in price behaviour, accompanied by expanding Bollinger Bands and strengthening MFI readings, would alter the near-term momentum profile. Until such confirmation occurs, the chart reflects a basing environment within a broader corrective structure.
Disclaimer
This analysis is for informational purposes only and should not be considered financial advice. Investors and traders should conduct their own research and consider individual risk tolerance before making any investment decisions.

Tradable assets:
Min.Deposit:
Max Leverage:
FCA:

Rating:
 Earnings Calendar
  Economic Calendar
  VAT Calculator
  Tax Free Childcare Calculator
 Percentage Calculator
 Compound Interest Calculator
  Loan Overpayment Calculator
 Mortgage Calculator
 Credit Card Calculator
 Investing
  Economics
 Trading
  Technical Analysis
  Personal Finance
 Calculator