Visa Stock Analysis: Is Visa a Strong Opportunity Ahead of Q4 Earnings?
$325.48
28 Jan 2026, 19:25
Bullish
Data from IG - Timeframe - Daily
Market Overview
Nvidia has a long-standing pattern of experiencing short-term pullbacks around the 20th of November, especially when earnings releases approach. These dips have historically acted as corrective pauses rather than structural trend reversals, often setting the stage for the next leg higher in the broader bullish cycle. The latest earnings expectation reflects a slight moderation, with analysts forecasting EPS at $1.18 compared with the previous $1.24. While this softening may trigger temporary caution, it continues to align with the company’s longer-term growth narrative.
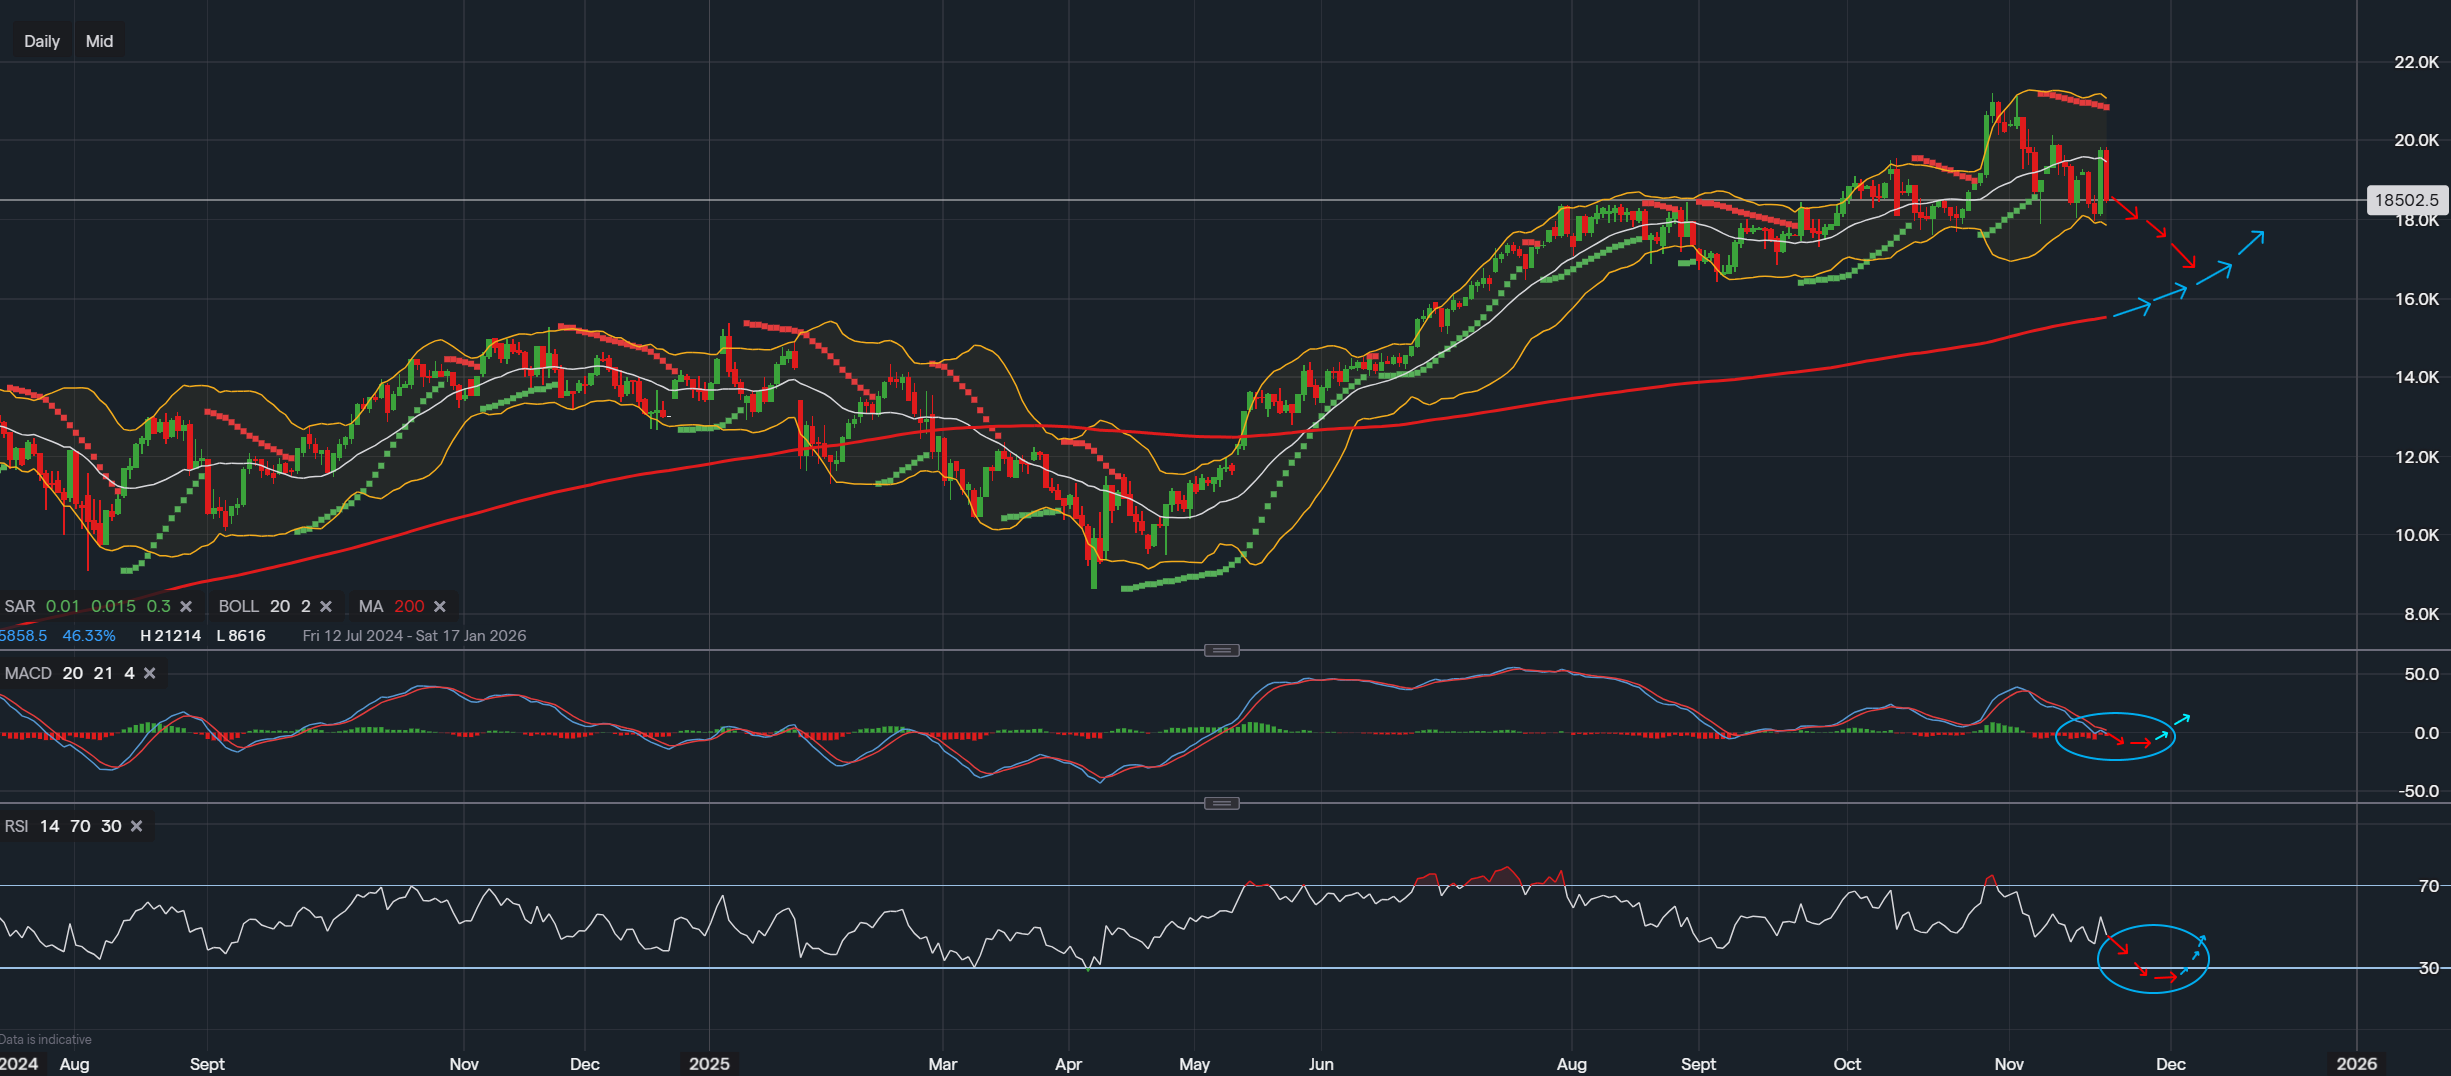
Price Structure and Trend Behaviour
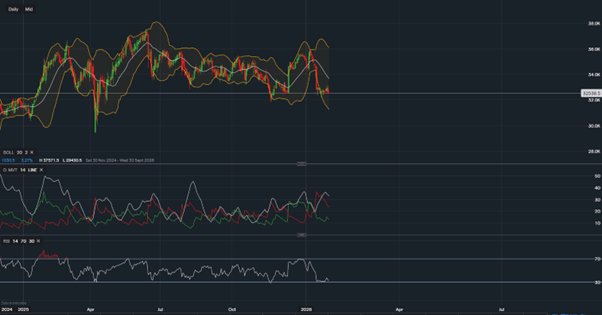
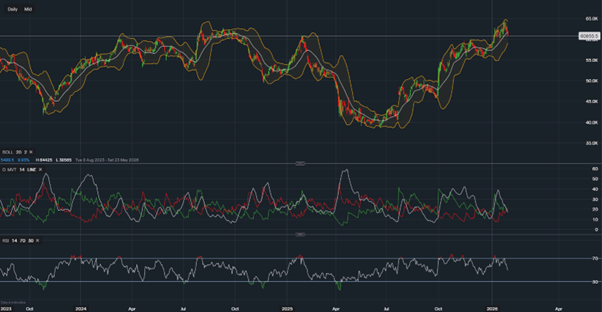
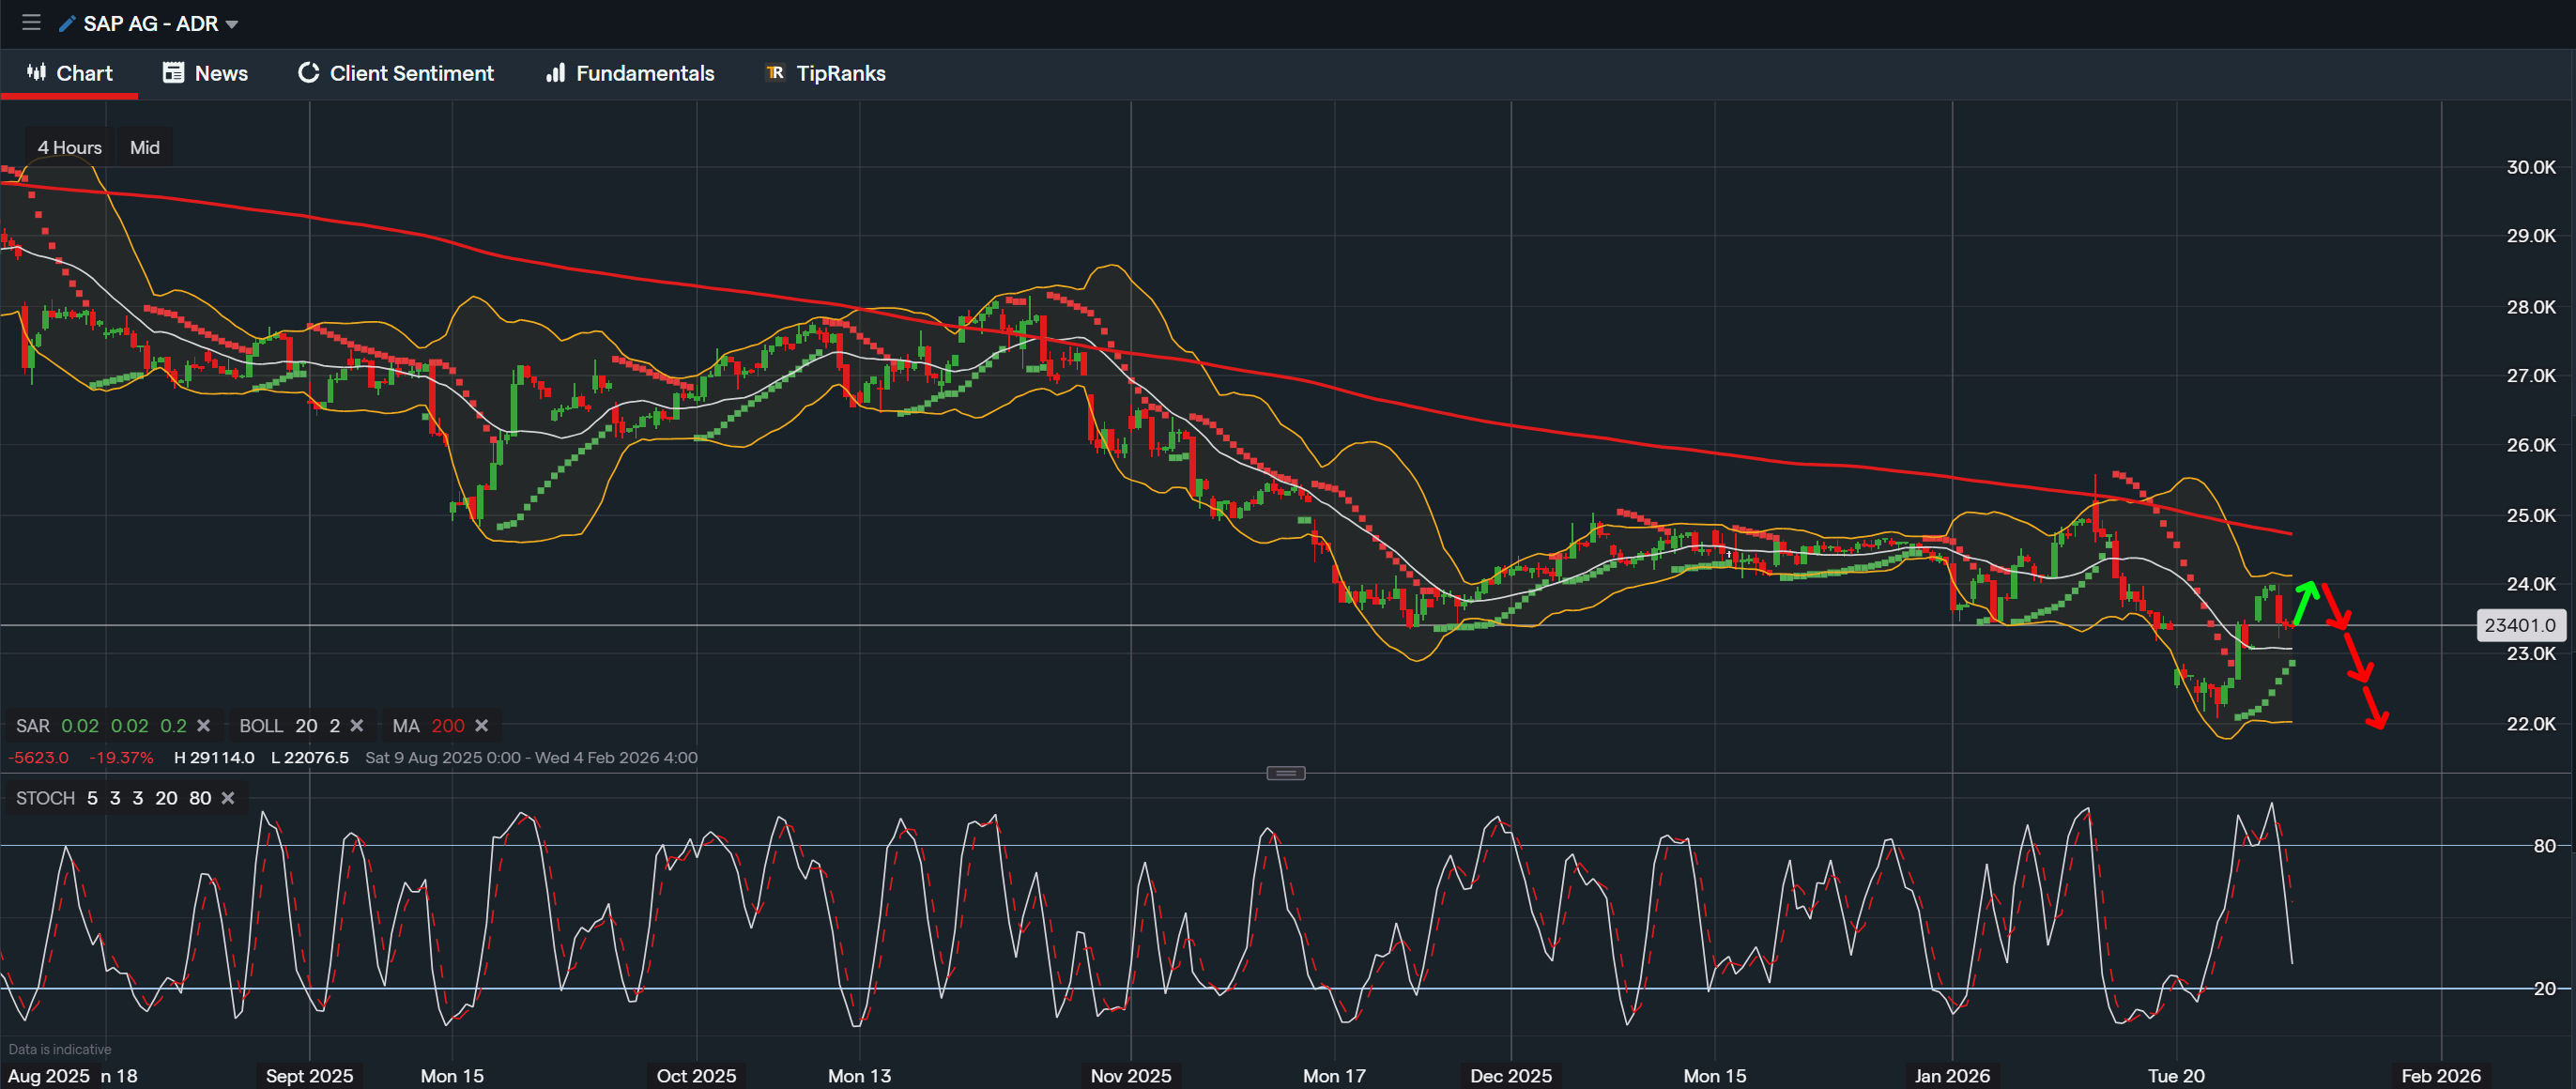
The chart shows that Nvidia remains in a broader uptrend, though it is currently navigating a corrective phase. The price has retreated from the upper Bollinger region and slipped into the mid-range of the band, where downside pressure is visible. The red arrow scenario illustrates the possibility of further downward movement, particularly as the candles hover near the lower half of the recent structure. The 200-day moving average sits comfortably beneath price and continues sloping upward, reinforcing the idea that the macro trend remains intact despite short-term softness.
If the market finds support near the region marked by the blue arrows, a stabilisation phase could emerge. Historically, Nvidia has often respected its long-term moving averages and used these zones as springboards for fresh bullish momentum. This suggests that unless the broader market undergoes significant stress, deeper pullbacks may still be met with buying interest from longer-horizon investors.
Momentum and MACD Signals
The MACD reveals weakening momentum, with the histogram dipping below the midline and the signal lines tilting downward. This reflects the current corrective pressure and supports the idea that the stock may still have room to unwind. However, the downward momentum is not accelerating aggressively, which opens the door for a potential shift back to equilibrium. Should the MACD begin flattening in the area you’ve highlighted, it could indicate the early stages of a momentum reset, where sellers lose strength and buyers begin preparing for re-entry.
RSI and Market Sentiment
The RSI sits near the lower boundary of its range, signalling increasingly oversold conditions. This is typically where Nvidia has bounced historically during its uptrend phases. If the RSI dips slightly lower and holds near the zone highlighted, the market could attract value-driven traders and longer-term investors eyeing re-entry opportunities. Conversely, a decisive drop beneath this band would suggest that bearish pressure has not fully exhausted itself, aligning with the short-term red arrow scenario on the price chart.
Conclusion
Nvidia’s technical landscape currently reflects a classic earnings-week correction, consistent with its seasonal behaviour. The broader trend remains bullish, supported by the upward-sloping 200-day moving average and the long-term structure of higher highs and higher lows. In the shorter term, momentum indicators show cooling conditions, which could translate into either a controlled continuation lower or a base-building phase before the next directional push.
Although short-term volatility may increase around the earnings release, the prevailing market structure leans more towards consolidation than structural reversal. This keeps both bullish continuation and value-oriented accumulation firmly on the table as potential pathways ahead.
Disclaimer:
This analysis is for informational purposes only and should not be considered financial advice. Investors and traders should conduct their own research and consider individual risk tolerance before making any investment decisions.

Tradable assets:
Min.Deposit:
Max Leverage:
FCA:

Rating:


 Earnings Calendar
  Economic Calendar
  VAT Calculator
  Tax Free Childcare Calculator
 Percentage Calculator
 Compound Interest Calculator
  Loan Overpayment Calculator
 Mortgage Calculator
 Credit Card Calculator