Visa Stock Analysis: Is Visa a Strong Opportunity Ahead of Q4 Earnings?
$325.48
28 Jan 2026, 19:25
Bullish
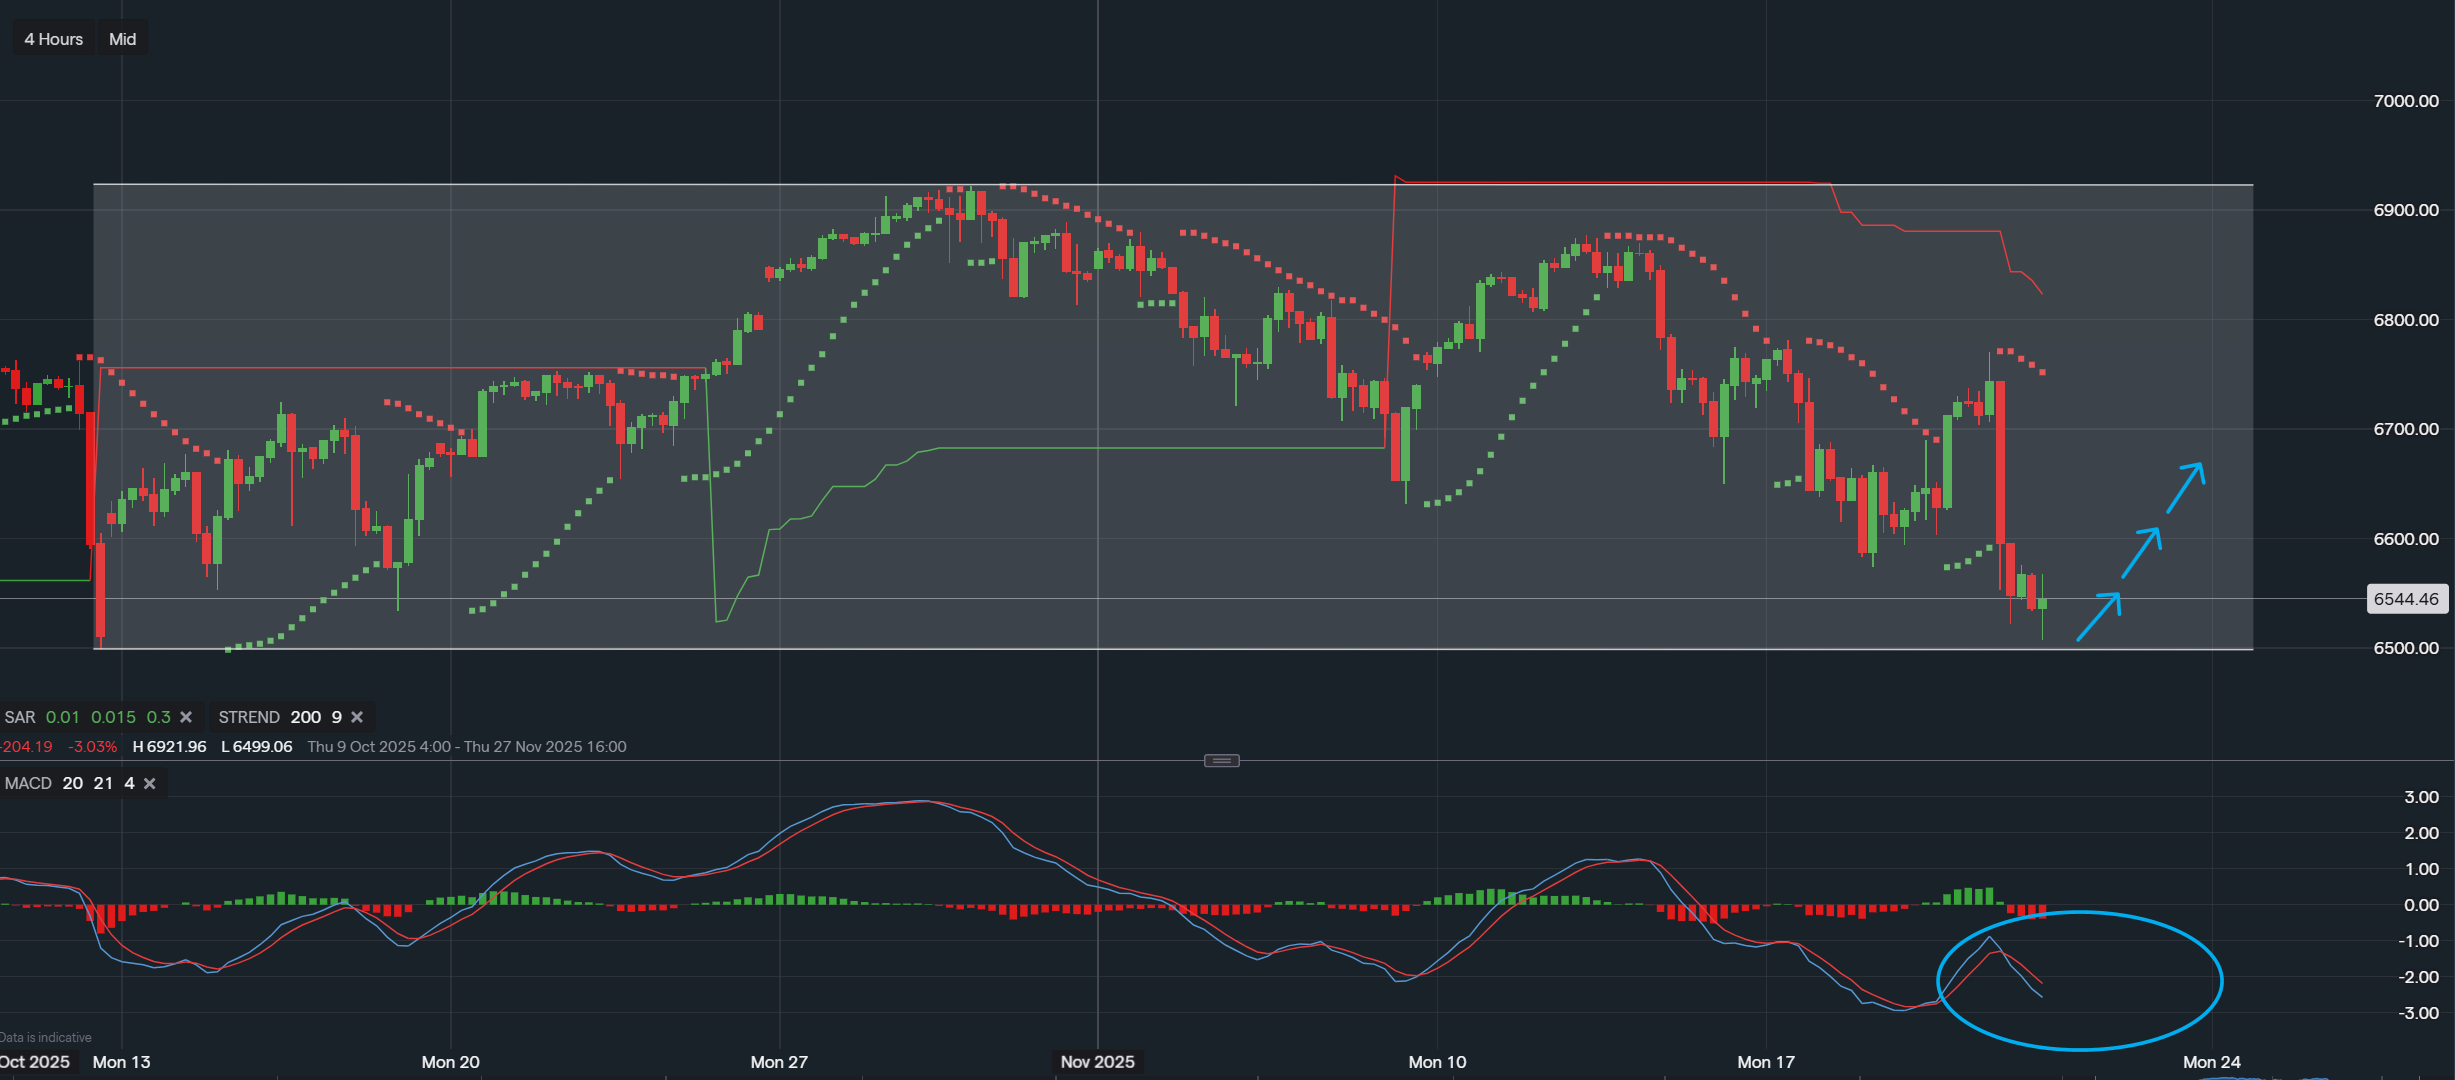
Data from IG - Timeframe - 4hr
Market Structure Overview
The S&P 500 currently sits within a well-defined horizontal channel that has contained price action for several weeks. This range has acted as the dominant structure guiding market behaviour, with the upper boundary repeatedly capping rallies and the lower boundary consistently attracting buyers. The latest move has brought the index back into the lower region of this channel, a zone that historically has encouraged demand to re-enter the market. For both traders and long-term investors, this structure suggests the market is in a controlled consolidation phase rather than a chaotic downtrend, keeping the broader outlook balanced and potentially constructive.
Channel Dynamics and Price Behaviour
Price action is now pressing toward the lower boundary of this established range, an area that has been highlighted as a potential turning point in previous cycles. Each historical touch of this region has been followed by a recovery toward the mid-range or the upper band of the channel, making the current positioning particularly significant. The recent candles show sellers losing some of the strong momentum they displayed at the start of the decline, and although downside pressure is still visible, it has begun to slow as price approaches familiar support. If buyers respond in the same way they have throughout the channel’s lifespan, the market may find itself preparing for a gradual transition back toward the upper half of the range.
Momentum Outlook Through the MACD
The MACD indicator reflects the market’s short-term hesitation. The histogram remains negative, and the MACD line sits below the signal line, which confirms that downward momentum is still active. However, the angle of decline has begun to soften, suggesting the possibility that bearish momentum is losing strength. In previous instances within this channel, a similar MACD configuration—where the lines begin to converge at deeply negative levels—has often been a precursor to a momentum reversal.
If the MACD continues to compress and eventually allows the MACD line to cross back above the signal line, it would indicate that momentum is shifting in favour of buyers. Such a development would align neatly with the price’s proximity to channel support, making this upcoming MACD behaviour an important factor to watch. The alternative scenario is that momentum must first complete one more downward push, allowing price to tag or slightly pierce the channel floor before any rebound can develop.
Potential Upside Scenario Within the Range
While short-term selling pressure remains evident, the broader structure still favours the possibility of an upside rotation. The channel has held firm over time, and the market’s position near the lower boundary provides the technical foundation for a potential recovery. If momentum confirms a shift—particularly through a MACD crossover or a visible slowdown in downside velocity—price may work its way back toward the mid-channel levels, where the first layer of resistance typically appears. A continuation of that recovery could later reintroduce the upper channel boundary as a target, keeping the long-term bullish narrative intact.
For investors, this consolidation phase may represent a period of stabilisation rather than weakness. For traders, the proximity to support and the behaviour of the MACD suggests a region where market sentiment may begin to pivot.
Conclusion
The S&P 500 remains structurally stable inside a broad consolidation channel that has repeatedly acted as a dependable roadmap for market behaviour. With price pressing toward familiar support and momentum indicators hinting at a potential recalibration, the chart suggests that the market may be preparing for its next upward rotation provided support holds and momentum begins to shift back in favour of buyers. While nothing is guaranteed, the technical landscape continues to lean toward the possibility of an eventual recovery within the channel, making this region a focal point for traders and investors watching for the next directional cue.
Disclaimer:
This analysis is for informational purposes only and should not be considered financial advice. Investors and traders should conduct their own research and consider individual risk tolerance before making any investment decisions.

Tradable assets:
Min.Deposit:
Max Leverage:
FCA:

Rating:


 Earnings Calendar
  Economic Calendar
  VAT Calculator
  Tax Free Childcare Calculator
 Percentage Calculator
 Compound Interest Calculator
  Loan Overpayment Calculator
 Mortgage Calculator
 Credit Card Calculator