Visa Stock Analysis: Is Visa a Strong Opportunity Ahead of Q4 Earnings?
$325.48
28 Jan 2026, 19:25
Bullish
Data From IG - Timeframe - Monthly
TMO Stock Overview
Thermo Fisher Scientific (TMO) remains a dominant force within the life sciences, research, and diagnostics sectors, supported by a substantial market capitalisation of $222.89 billion. This scale reflects the company’s industry leadership and reinforces its appeal to traders and investors seeking long-term exposure to high-quality healthcare innovation.
Valuation Overview
TMO’s current price-to-earnings (P/E) ratio of 34.28 positions the stock at a market premium, indicative of strong confidence in its business model and earnings durability. The forward P/E ratio of 24.11 reinforces expectations of meaningful earnings growth over the coming year. Together, these valuation metrics point toward continued expansion potential, making TMO an attractive candidate for growth-focused portfolios.
Analyst Sentiment
Analyst coverage remains firmly optimistic. According to TipRanks, 20 analysts currently maintain a predominantly “Buy” stance, signaling strong institutional confidence and providing reassurance to investors assessing favourable entry opportunities.
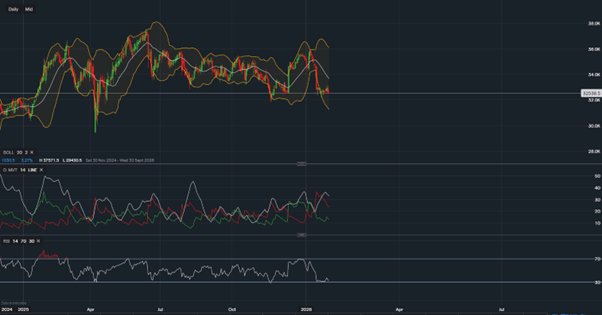
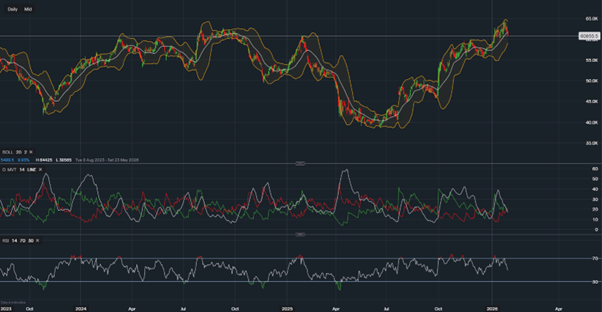
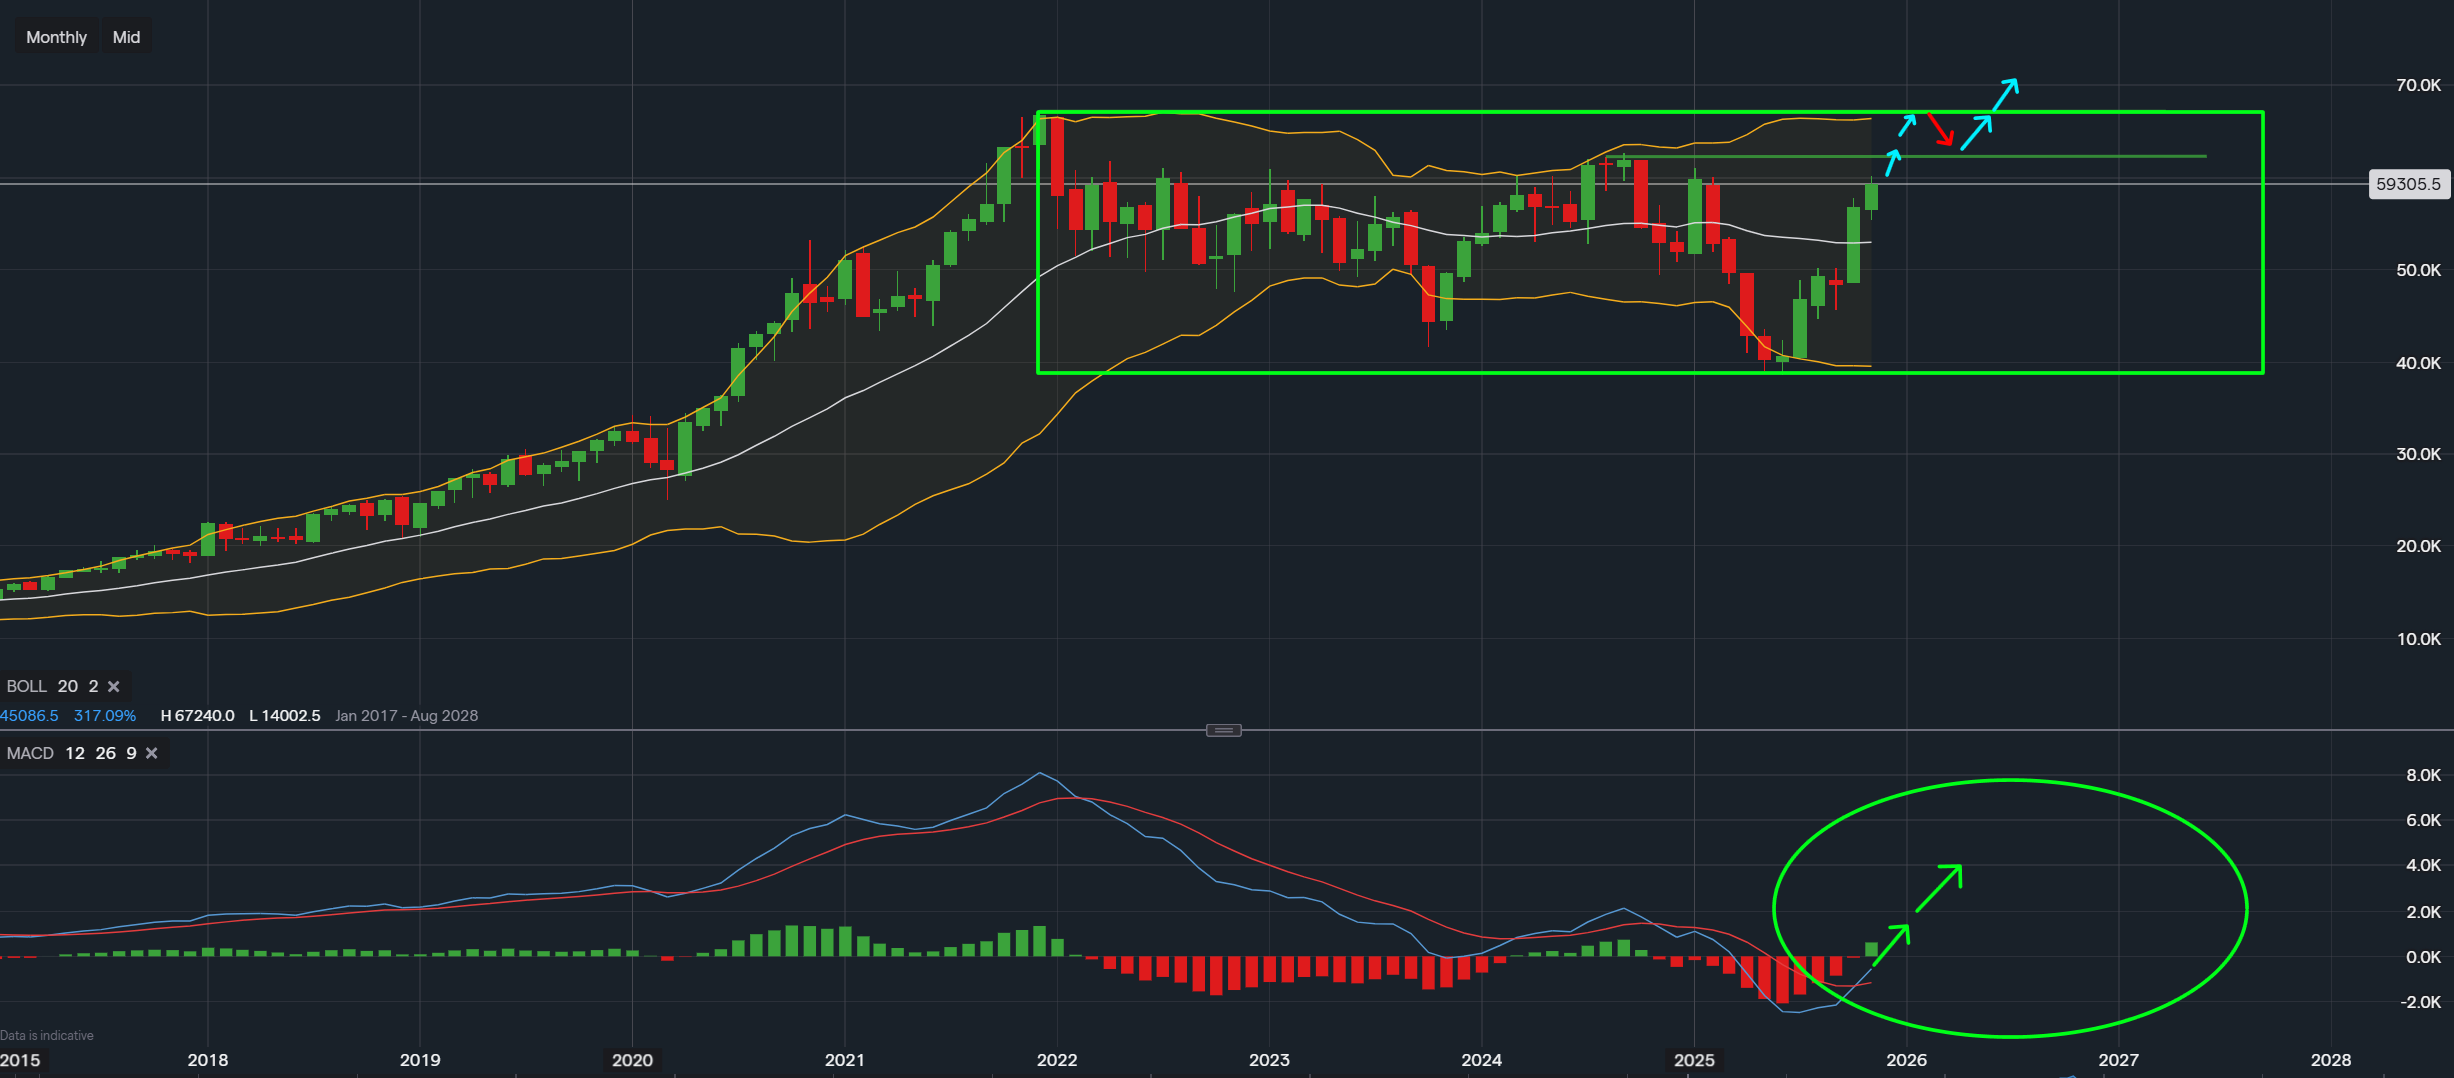
Bollinger Bands & MACD Momentum Outlook
A combined assessment of Bollinger Bands and MACD highlights a constructive shift in TMO’s technical landscape. Price has recently rebounded from the lower Bollinger Band, suggesting a transition away from oversold conditions and signalling stabilisation within the wider range. The tightening of the bands further implies compressing volatility, often a precursor to directional expansion.
At the same time, the MACD has registered a bullish crossover, with the MACD line moving above the signal line and momentum strengthening through expanding positive histograms. This alignment between volatility contraction and growing upward momentum strengthens the case for a sustained bullish move, echoing previous phases of trend continuation within TMO’s historical price action.
Price Targets and Market Outlook
With technical support clearly forming and momentum indicators favouring the upside, TMO appears well-positioned to advance. The stock is on track to challenge initial resistance around $623.48, with a successful breakout opening the path toward the next upside target at approximately $672.23. While interim pullbacks may occur as price approaches key levels, such movements would likely act as consolidation phases within a broader bullish structure.
Investors and traders should continue to monitor trading volume and overall market sentiment to validate follow-through strength. As it stands, the combination of solid fundamentals, strong analyst backing, and improving technical conditions supports a positive medium-term outlook for TMO.
Disclaimer
This analysis is for informational purposes only and should not be considered financial advice. Investors and traders should conduct their own research and consider individual risk tolerance before making any investment decisions.

Tradable assets:
Min.Deposit:
Max Leverage:
FCA:

Rating:


 Earnings Calendar
  Economic Calendar
  VAT Calculator
  Tax Free Childcare Calculator
 Percentage Calculator
 Compound Interest Calculator
  Loan Overpayment Calculator
 Mortgage Calculator
 Credit Card Calculator