Alphabet A Stock Analysis: Oversold Opportunity or Continued Downtrend?
$274.19
29 Mar 2026, 13:55
Bullish

Join Minipip Academy and access free courses in investing, trading, economics, and more.
Sign Up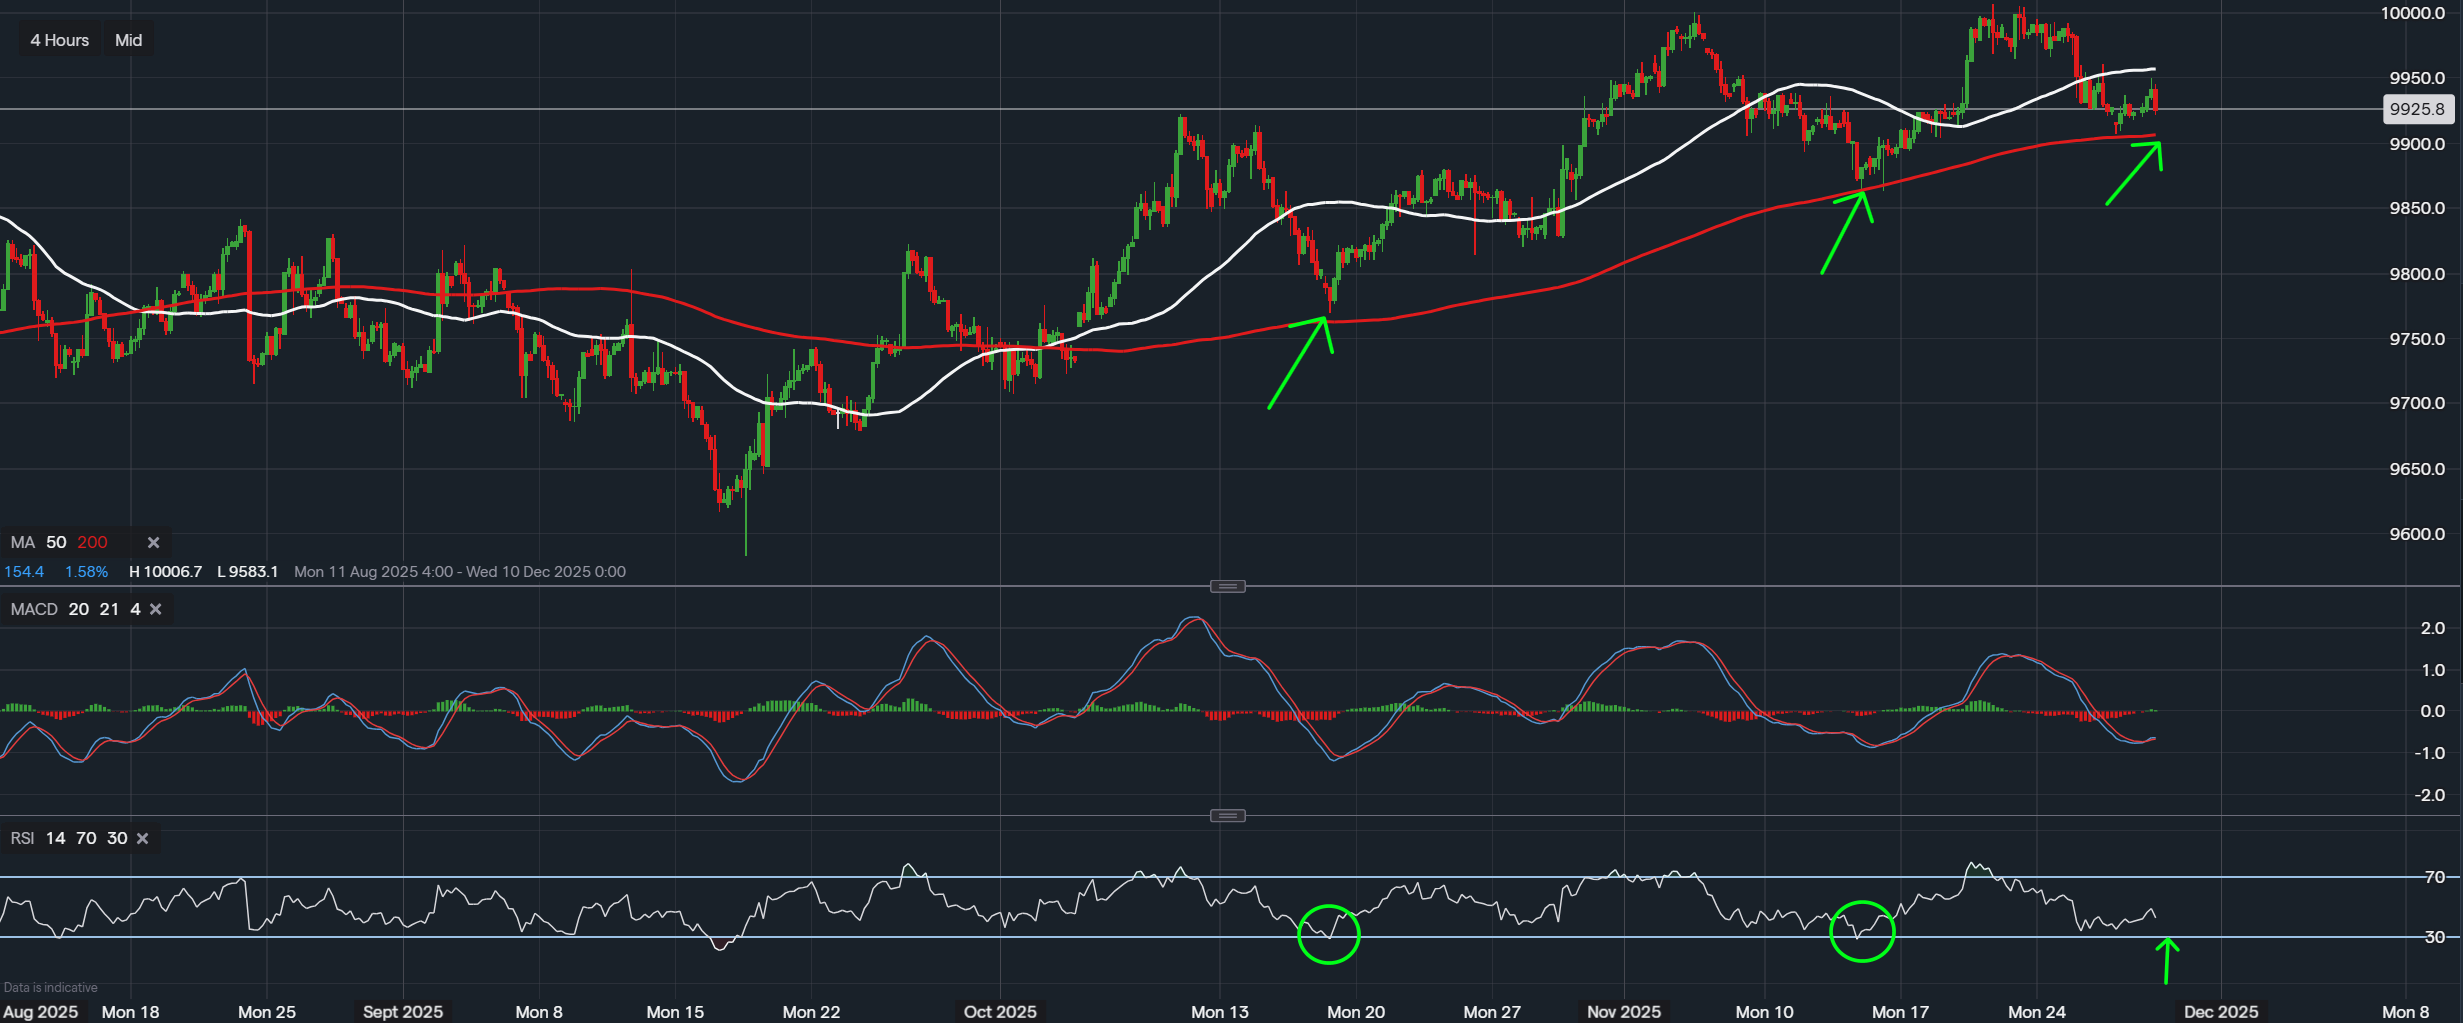
Data from IG - Timeframe - 4H
Market Overview
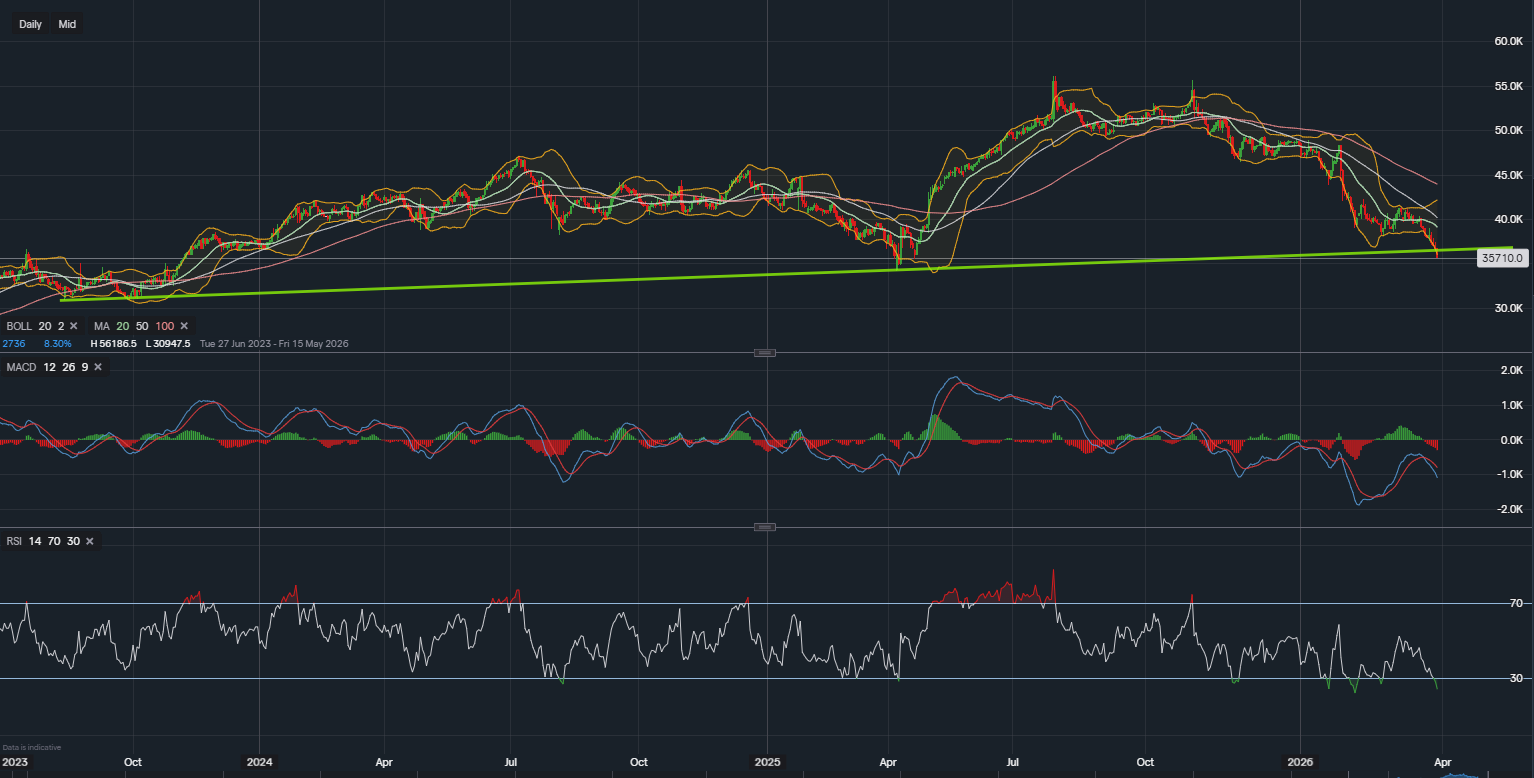
The US Dollar Basket continues to demonstrate a recurring pattern of resilience, repeatedly respecting key technical levels that have historically signalled a shift in momentum. Recent price action suggests that the index may once again be approaching a zone where bullish interest has previously strengthened.
Price Structure and Moving Average Dynamics
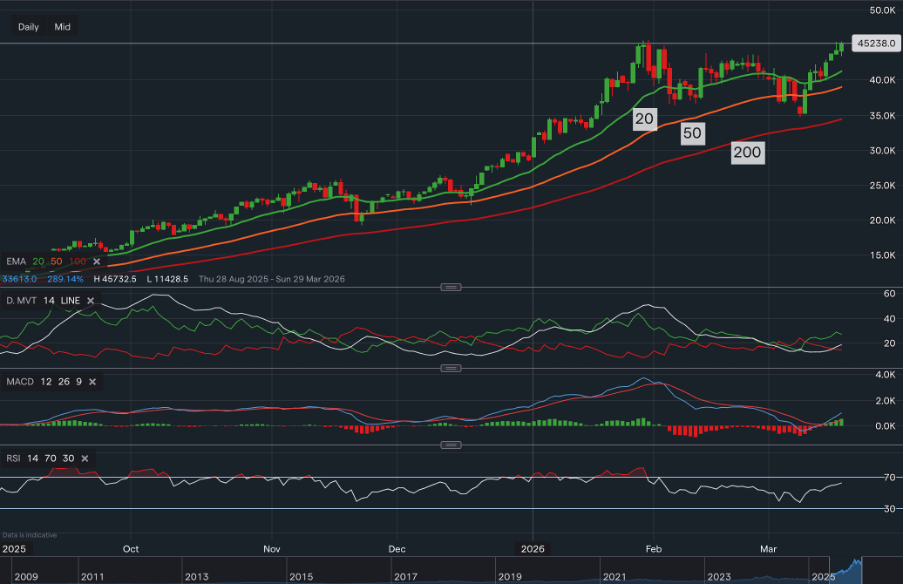
Price has shown a clear tendency to rebound from the 200-period moving average, with each touch of this long-term trend indicator aligning with renewed upside movement. This behaviour is visible on several occasions throughout the chart, where the 200 MA has acted as a well-respected dynamic support level.
The 50-period moving average remains positioned above the 200 MA for most of the analysed structure, reflecting the broader bias that has accompanied these repeated rebounds. Although the short-term trend has recently softened, price remains positioned close to the 200 MA, keeping the prospect of another technical reaction alive should buyers step in again.
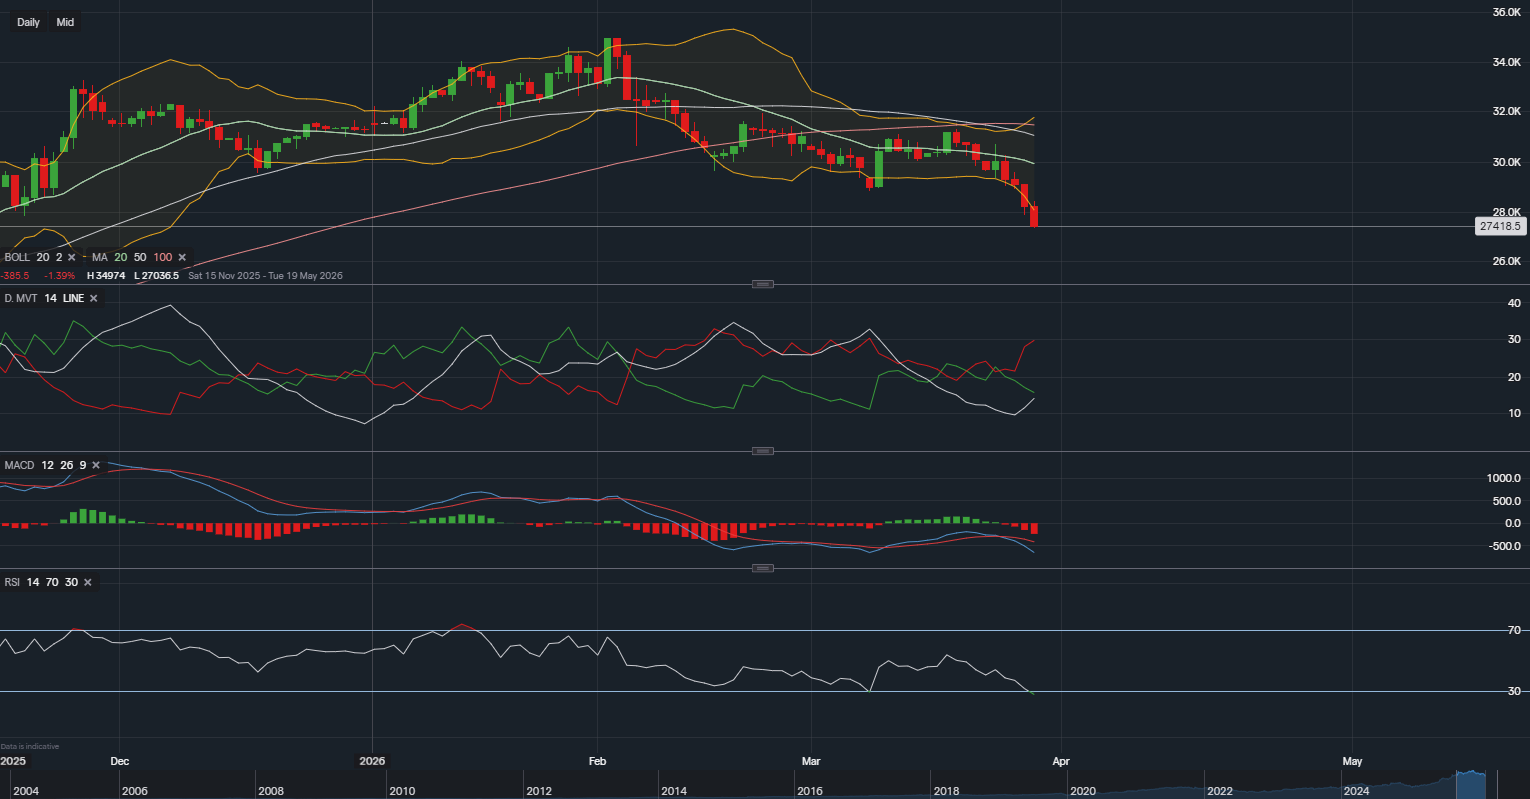
RSI Behaviour and Oversold Reversal Tendencies
The Relative Strength Index reinforces this narrative, as historical movements show that each approach into oversold territory has coincided with meaningful upside reversals. These repeated rebounds from near-30 RSI have lined up closely with price tests of the 200 MA, creating a dual-layered confluence that has provided buyers with favourable conditions in the past.
The RSI is once again moving closer to the oversold boundary. If it completes another test of this level, it may mirror earlier market behaviour and highlight an area where bullish interest could re-emerge. While not predictive, this consistency increases the technical significance of the current setup.
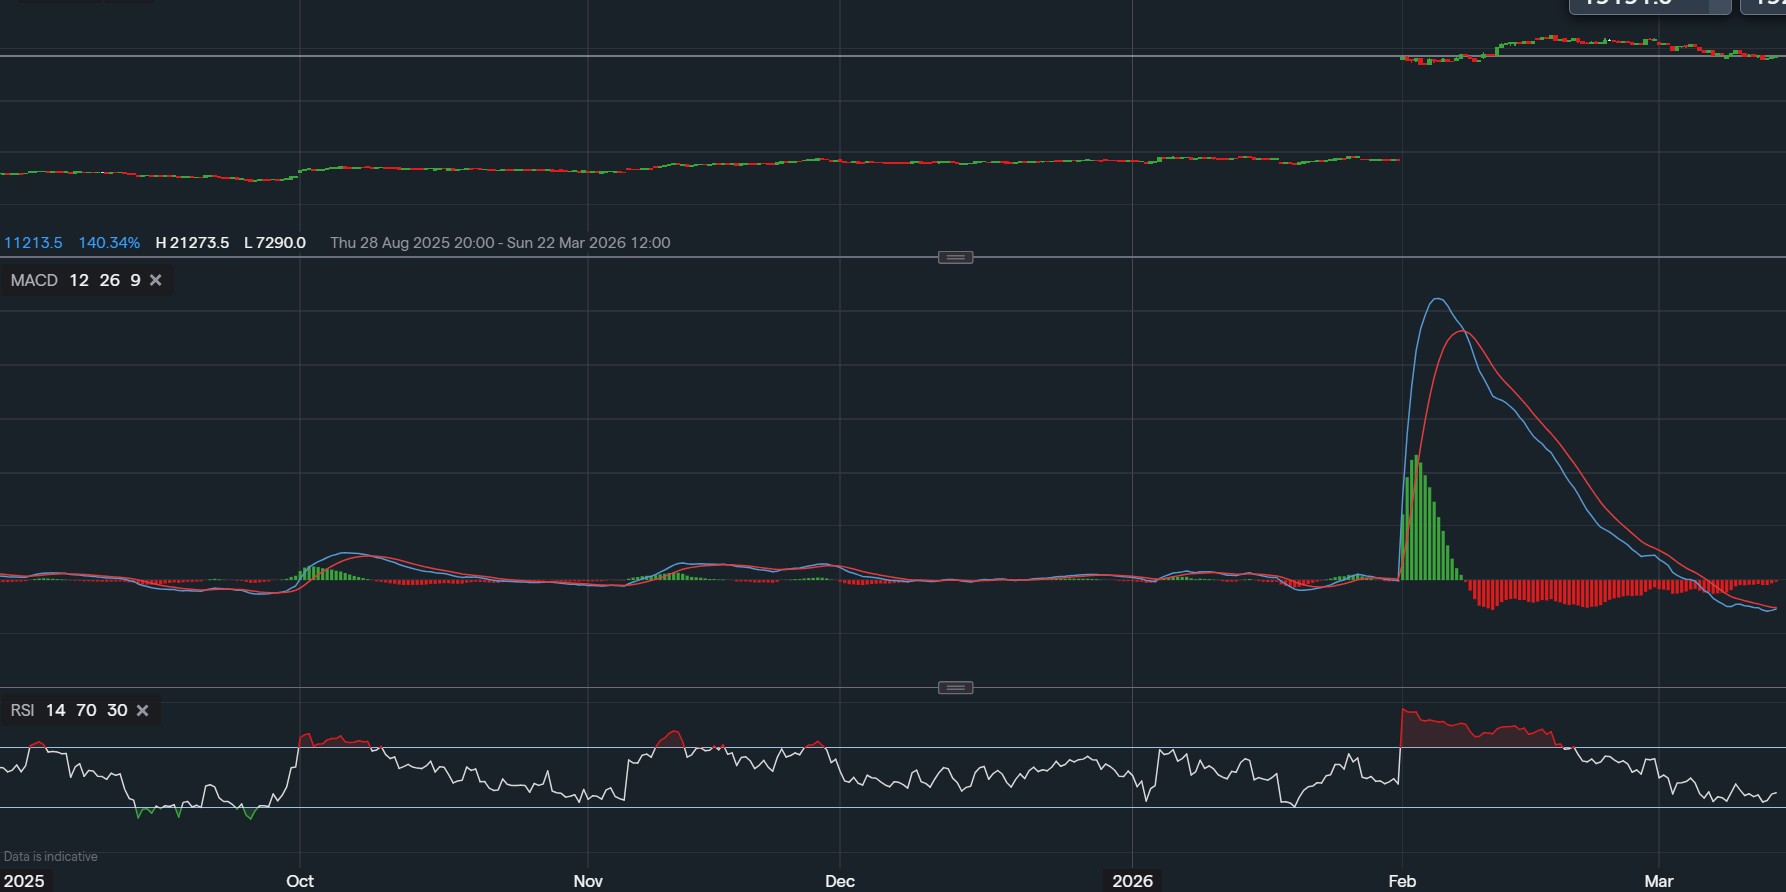
MACD Momentum Assessment
The MACD indicator is beginning to form an early bullish signal, with the MACD line attempting to cross above the signal line. Small histogram bars have also begun to appear, suggesting a preliminary shift in momentum. However, these early movements may lag behind the RSI, as the MACD often requires broader price commitment before confirming a trend change.
Should RSI reach its oversold region and price react once more at the 200 MA, a clearer MACD confirmation could develop, strengthening the technical argument for improving bullish momentum. Until then, MACD remains in a cautious, early-transition phase.
Conclusion
The US Dollar Basket is entering a technically significant zone where historical behaviour shows repeated buyer engagement. Confluence between the approaching oversold RSI, price proximity to the 200-period moving average, and a developing MACD crossover suggests that conditions are aligning for potential bullish interest. While confirmation is still required, current signals reflect a market that may be nearing a familiar turning point.
Disclaimer
This analysis is for informational purposes only and should not be considered financial advice. Investors and traders should conduct their own research and consider individual risk tolerance before making any investment decisions.

Tradable assets:
Min.Deposit:
Max Leverage:
FCA:

Rating:


 Earnings Calendar
  Economic Calendar
  VAT Calculator
  Tax Free Childcare Calculator
 Percentage Calculator
 Compound Interest Calculator
  Loan Overpayment Calculator
 Mortgage Calculator
 Credit Card Calculator
 Investing
  Economics
 Trading
  Technical Analysis
  Personal Finance
 Calculator