Netflix Stock Analysis: Is a Bullish Reversal Forming?
$90.21
09 Jan 2026, 09:52
Bullish
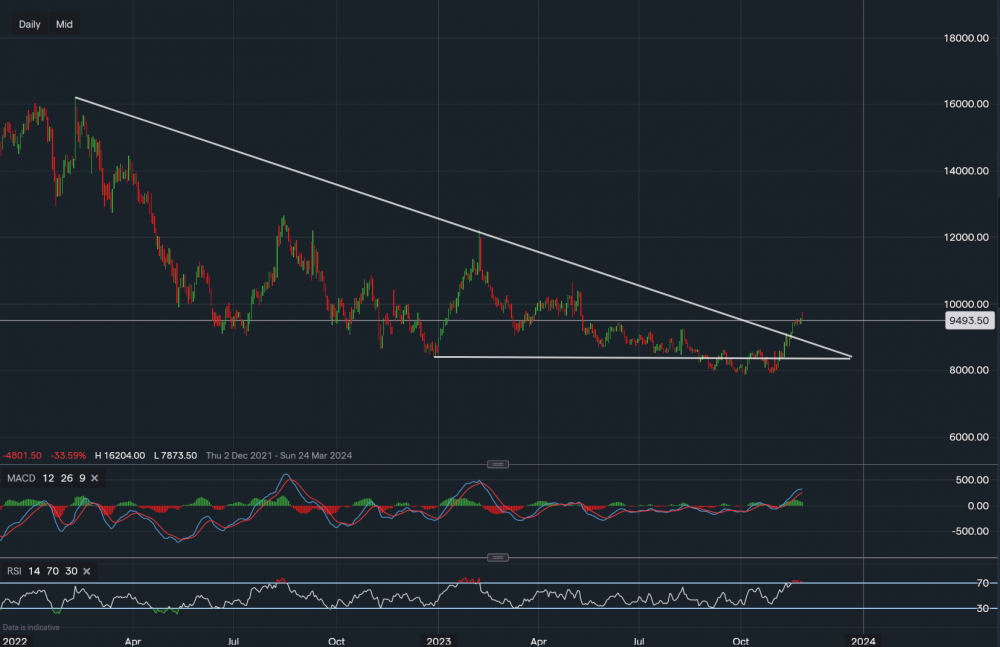
Chart & Data from IG
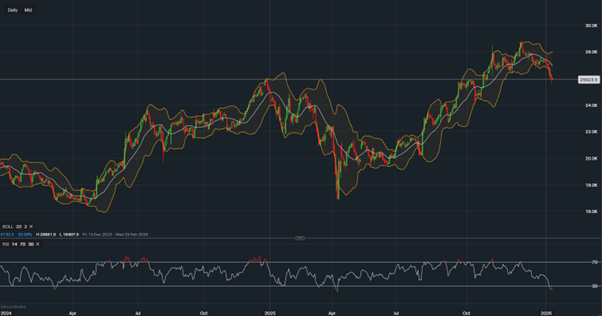
Taking a look at Disney as the media and entertainment conglomerate seems like it may have broken out of its longer-term bearish trend. Currently, its shares are trading at around $94.93 a share. Looking at the chart, we can see that the break occurred on the 14th of November, with a strong move higher the following day. The price has also closed above the resistance of $94.42, which has been a challenging level in the past. Hence, the new resistance on the radar for investors now is $97.96 followed by $99.95. A break above $99.95 could perhaps then see a push towards $105 a share. Towards the downside, the key support sits along the trendline approximately at $87.18. A break back into the triangle would suggest a mixed outlook for Disney with the likelihood of further downside increased once again. The new base support has been created around $78.73. Looking at the technical indicators, they are both clearly positive. But the RSI does suggest overbought conditions, therefore, a small pullback before a rise higher is possible.

(Chart & Data from IG)


Tradable assets:
Min.Deposit:
Max Leverage:
FCA:

Rating: