General Dynamics (GD) Fundamental and Technical Stock Analysis: Can the Defence Prime Keep Outperforming?
$364.70
04 Mar 2026, 12:54
Neutral

Join Minipip Academy and access free courses in investing, trading, economics, and more.
Sign Up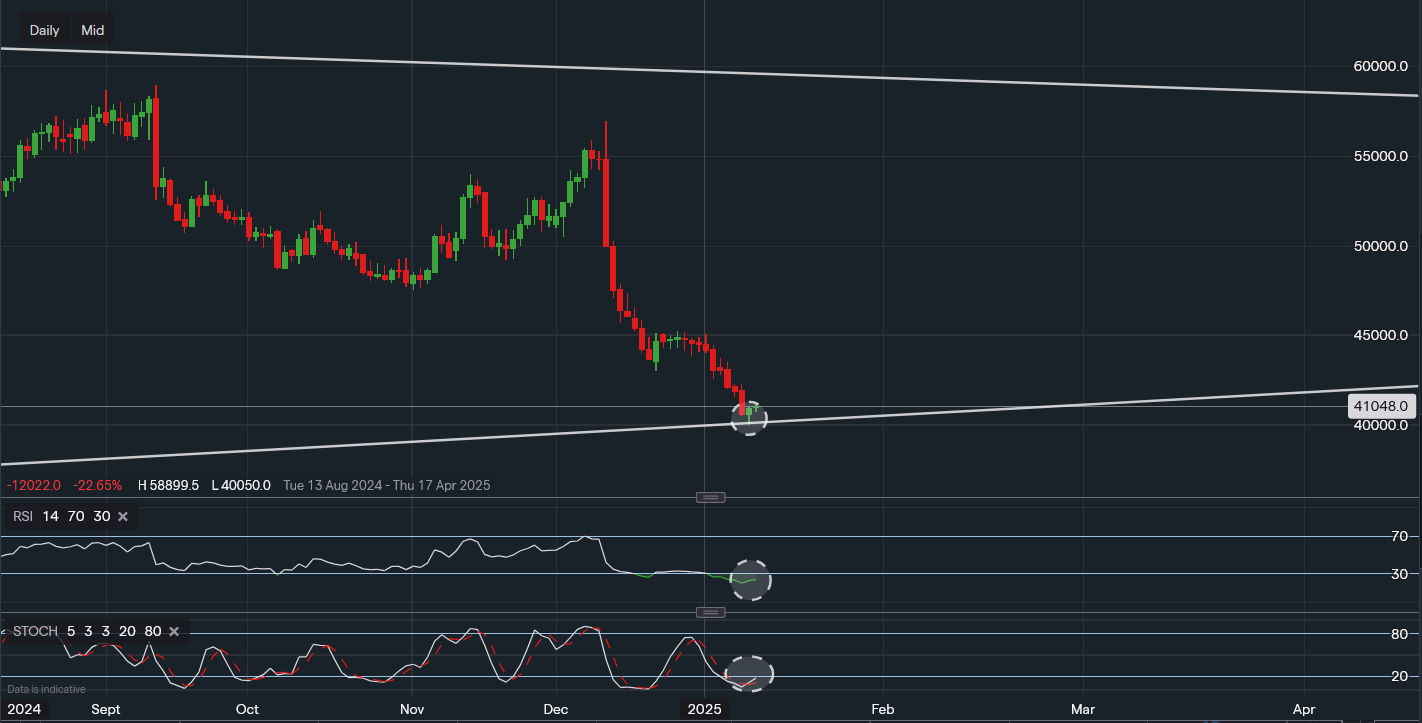
Chart & Data from IG
Adobe is currently trading at a critical trendline support on the daily chart, making it a key stock to watch. The stock closed yesterday with a green daily candlestick, indicating potential bullish momentum as buyers may step in for a minor bounce off this trendline.
If Adobe’s share price successfully bounces off this support, a 4-5% rally could be on the cards, potentially lifting the stock to $430 per share. A sustained increase in momentum might push the price further toward $450, where we expect significant resistance. At this level, profit-taking by traders could stall further upward movement.
Technical indicators suggest that Adobe is currently oversold, with the Relative Strength Index (RSI) at 24. Additionally, the stochastic oscillator is also in oversold territory. These conditions could attract buyers looking for a potential reversal or short-term rally.
Despite the potential for a bounce, a break below the trendline support—particularly beneath the psychological $400 level—could trigger further selling pressure. In this bearish scenario, the stock might decline to the next support zone, around $350-$360 per share.
Adobe’s stock performance is at a pivotal juncture. Traders should watch for a confirmed bounce off the trendline support or a breakdown below $400 for clues about the stock’s next move. As technical indicators signal oversold conditions, the potential for a short-term rally remains strong, but caution is warranted if the price fails to hold above key support levels.
Keep an eye on market sentiment and broader tech sector trends for additional context in the coming sessions.

Tradable assets:
Min.Deposit:
Max Leverage:
FCA:

Rating:


 Earnings Calendar
  Economic Calendar
  VAT Calculator
  Tax Free Childcare Calculator
 Percentage Calculator
 Compound Interest Calculator
  Loan Overpayment Calculator
 Mortgage Calculator
 Credit Card Calculator
 Investing
  Economics
 Trading
  Technical Analysis
  Personal Finance
 Calculator


