General Dynamics (GD) Fundamental and Technical Stock Analysis: Can the Defence Prime Keep Outperforming?
$364.70
04 Mar 2026, 12:54
Neutral

Join Minipip Academy and access free courses in investing, trading, economics, and more.
Sign Up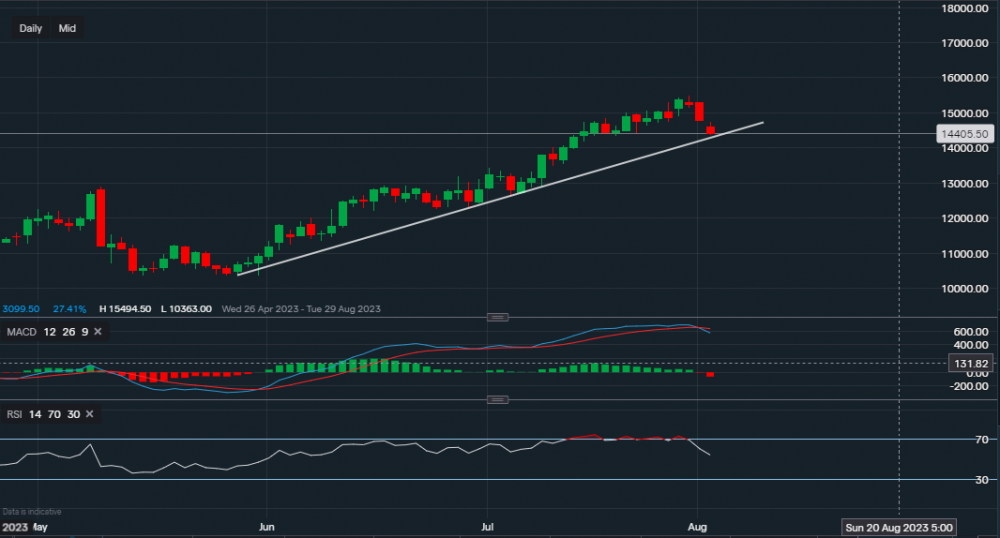
Chart & Data from IG
Airbnb’s stock is now trading at around $144.05 after the last couple of days has been red. It is now approaching a key level of support at $142.75 (along the trendline), which dates back to the 26th of May. A break below this trendline could lead to a bigger pullback, with the next support level then of $134.93. Although, that would be a 6% move which would need to be prompted by a poor earnings outcome (due tomorrow). On the other hand, a positive earnings report may lead to some price consolidation along the trendline. In that scenario, we would then look at the resistance levels sitting at $147.34 then at $148.40 and then at $150.76. A move and close above $150.76 would offer a chance at reaching the high of this year once again ($154.94). Glancing at the technical indicators, MACD has just turned negative on the daily timeframe with a sharp decline from the RSI to 53. Strong indications that more downside is possible. Though for the time being support remains, and sometimes stocks/markets adjust themselves before big earnings. Enticing and deceiving investors to enter their positions. The next couple of days may be volatile so traders/investors should be cautious.


 Earnings Calendar
  Economic Calendar
  VAT Calculator
  Tax Free Childcare Calculator
 Percentage Calculator
 Compound Interest Calculator
  Loan Overpayment Calculator
 Mortgage Calculator
 Credit Card Calculator
 Investing
  Economics
 Trading
  Technical Analysis
  Personal Finance
 Calculator


