General Dynamics (GD) Fundamental and Technical Stock Analysis: Can the Defence Prime Keep Outperforming?
$364.70
04 Mar 2026, 12:54
Neutral

Join Minipip Academy and access free courses in investing, trading, economics, and more.
Sign Up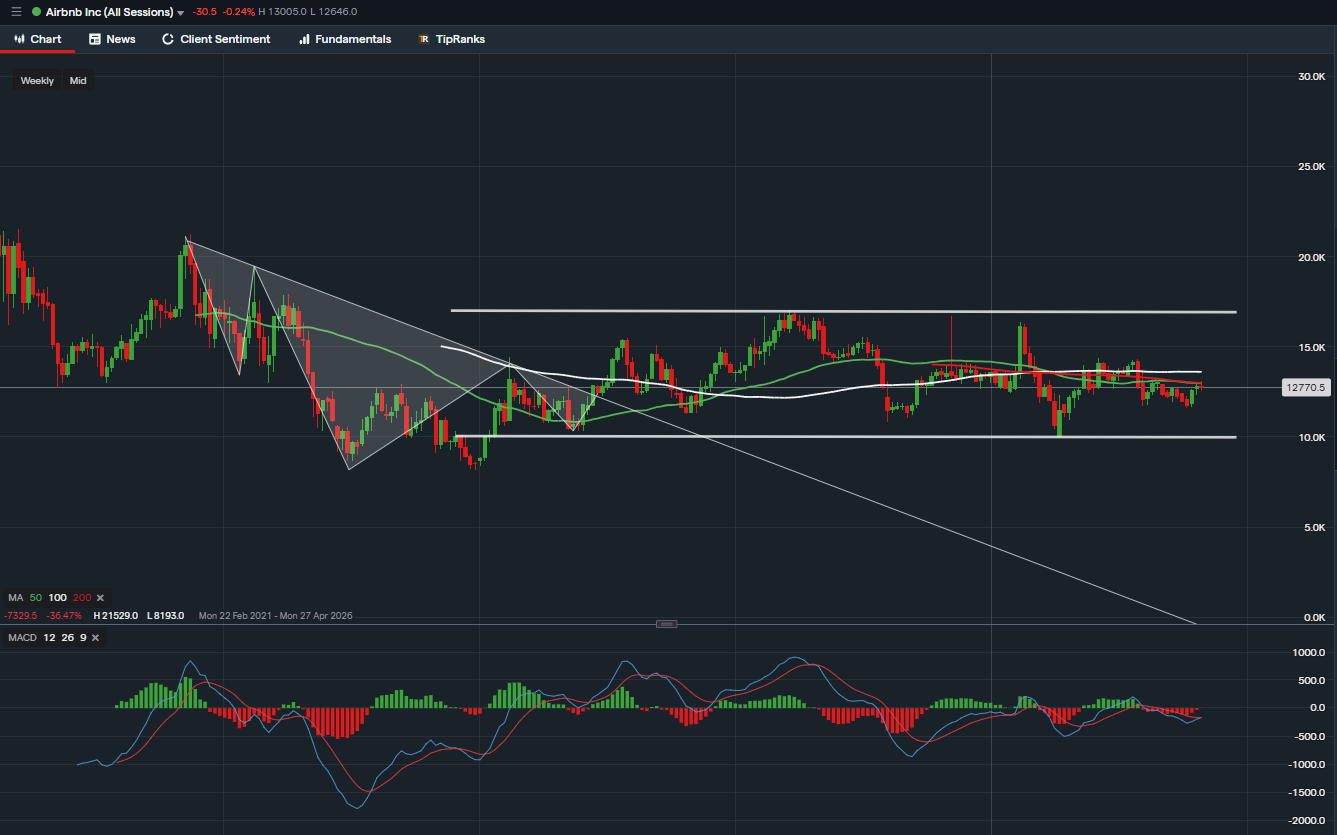
Airbnb TA - Weekly
Chart Structure and Pattern
On the weekly timeframe, Airbnb appears to have recently formed an inversed head and shoulders pattern, which often indicates a possible shift in momentum from bearish to bullish. However, the price has since entered a short consolidation phase, reflecting uncertainty as the market determines its next direction. This pause highlights the ongoing balance between buyers and sellers, with neither side yet showing a clear advantage.
Support and Resistance
The chart outlines a well-defined support zone near the lower boundary of the recent range and a resistance area near the recent highs. These levels underline the current tug-of-war between bulls and bears, illustrating the cautious confidence within the market. A decisive break beyond either boundary would likely confirm the next directional move, but until then, the price remains range bound.
Momentum and Indicators
The MACD line is currently close to crossing above the signal line, suggesting early signs of potential upward momentum. However, there is no clear green histogram forming yet, meaning the signal lacks confirmation. Moving averages are largely flattening out, reinforcing the broader picture of sideways consolidation rather than a sustained trend.
Analyst Sentiment
According to TipRanks, analyst sentiment for Airbnb remains balanced, with 31 ratings in total consisting of 11 Buys, 15 Holds, and 5 Sells. This even distribution indicates moderate confidence among analysts, aligning with the technical picture of indecision and consolidation.
Potential Market Scenarios
If the price breaks above the neckline of the inversed head and shoulders pattern, accompanied by strong volume, this could signal a more confident shift toward bullish momentum and potentially mark the start of a medium-term uptrend.
If the price fails to break higher and drifts back toward support, the consolidation phase may persist. In such a case, market participants could continue to see choppy or sideways action until fresh momentum builds in either direction.
At present, the battle between bulls and bears remains evenly balanced, with the recent high acting as resistance and the recent low holding as support. These are key reference points for traders and investors watching for confirmation of the next move.
Summary
While the current pattern shows potential, it remains incomplete until confirmation is established through price and volume. This overview reflects the market’s technical structure and sentiment, not a buy or sell recommendation.
Disclaimer: For educational purposes only. Not financial advice. Always do your own research before investing.

Tradable assets:
Min.Deposit:
Max Leverage:
FCA:

Rating:


 Earnings Calendar
  Economic Calendar
  VAT Calculator
  Tax Free Childcare Calculator
 Percentage Calculator
 Compound Interest Calculator
  Loan Overpayment Calculator
 Mortgage Calculator
 Credit Card Calculator
 Investing
  Economics
 Trading
  Technical Analysis
  Personal Finance
 Calculator


