General Dynamics (GD) Fundamental and Technical Stock Analysis: Can the Defence Prime Keep Outperforming?
$364.70
04 Mar 2026, 12:54
Neutral

Join Minipip Academy and access free courses in investing, trading, economics, and more.
Sign Up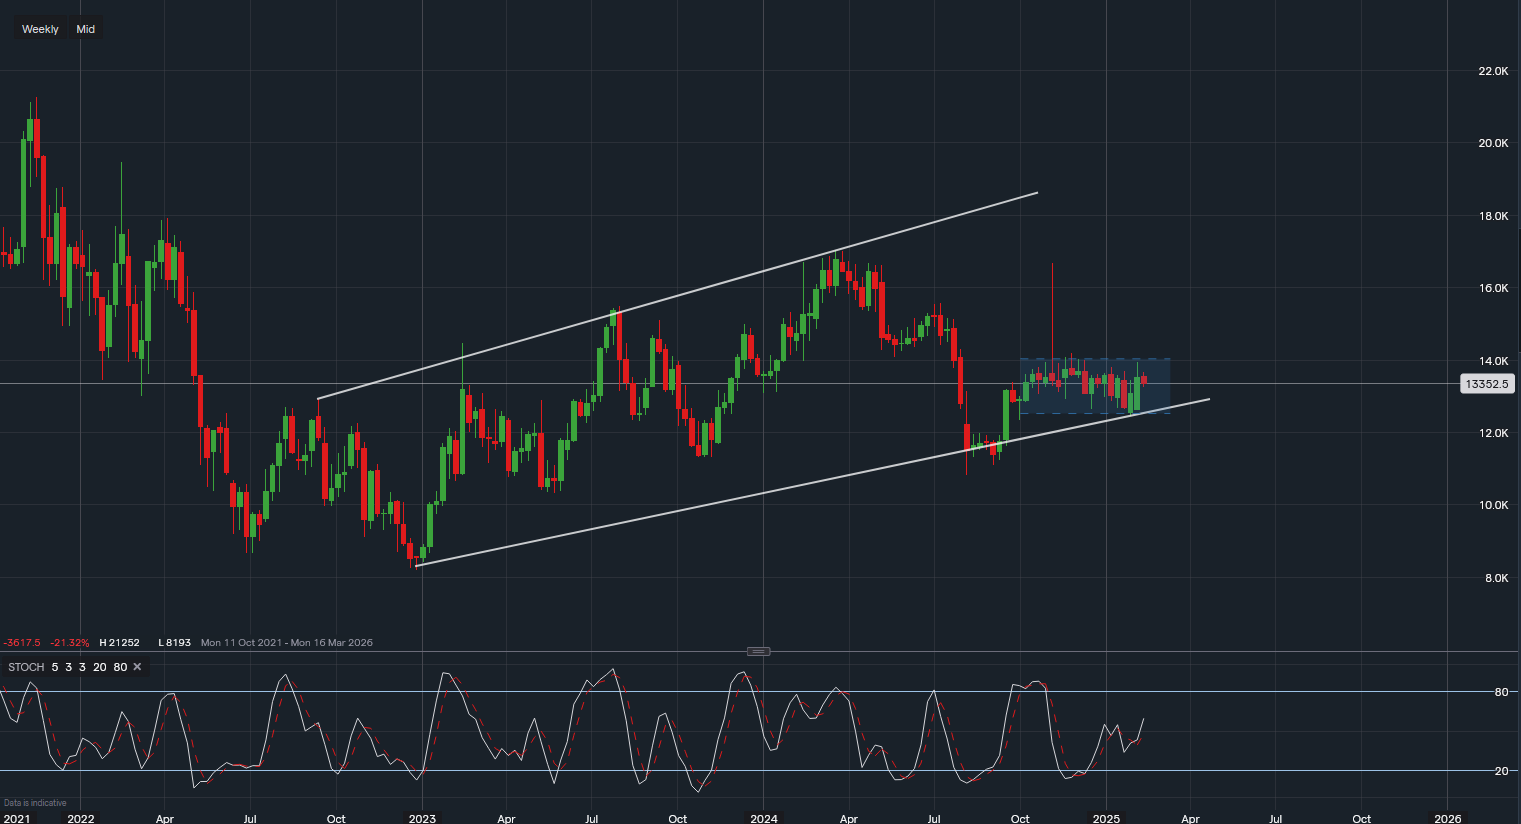
Chart & Data from IG
Airbnb (NASDAQ: ABNB) is set to release its earnings report tomorrow, and investors are watching closely for a potential breakout. Currently, Airbnb shares are trading around $133.52, consolidating since October 2023. This prolonged consolidation suggests that an explosive price move could follow the earnings announcement—especially on the weekly chart timeframe.
As Airbnb approaches earnings, key technical levels are in focus:
A break above $140 could trigger further upside momentum, potentially pushing the stock toward $155. Conversely, if Airbnb falls below $125, it may test the next key support zone at $108-$112.
With volatility likely after the earnings report, traders and investors should keep a close eye on breakout levels at $140 resistance and $125 support. A bullish move could send the stock to $155, while a bearish breakdown may lead to a retest of $108-$112.

Tradable assets:
Min.Deposit:
Max Leverage:
FCA:

Rating:


 Earnings Calendar
  Economic Calendar
  VAT Calculator
  Tax Free Childcare Calculator
 Percentage Calculator
 Compound Interest Calculator
  Loan Overpayment Calculator
 Mortgage Calculator
 Credit Card Calculator
 Investing
  Economics
 Trading
  Technical Analysis
  Personal Finance
 Calculator


