General Dynamics (GD) Fundamental and Technical Stock Analysis: Can the Defence Prime Keep Outperforming?
$364.70
04 Mar 2026, 12:54
Neutral

Join Minipip Academy and access free courses in investing, trading, economics, and more.
Sign Up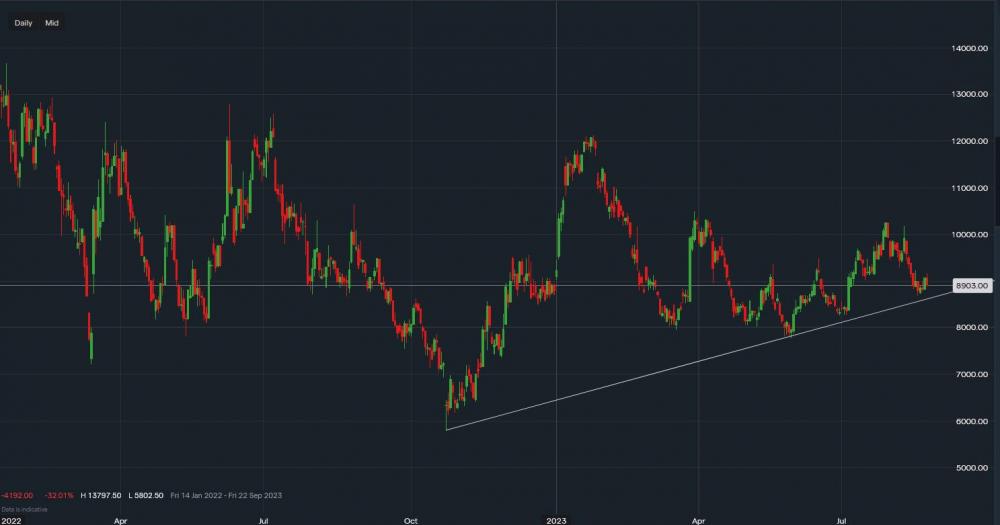
Chart & Data from IG
After the recent profit-taking, Alibaba’s stock is now trading at around $89.03 a share. Support sits along the trendline at $86.46, a break below it would not necessarily mean that a bearish trend is beginning to form as there are support levels also at $82.67 and then at $77.77. Towards the upisde, the first point of resistance is at $91.67 (yesterday’s high). A break above it would allow us to look at resistance levels sitting at $92.32 and then at $94.86. Looking at the technical indicators, MACD is still strongly negative, but volume seems to have lowered slightly. RSI is also negative as it reads 43. Overall, the technical suggests that further downside in the short-term is possible, we would need to see some consolidation in and around the trendline zone to re-analyse the short-term outlook. The longer-term outlook remains neutral.

Tradable assets:
Min.Deposit:
Max Leverage:
FCA:

Rating:


 Earnings Calendar
  Economic Calendar
  VAT Calculator
  Tax Free Childcare Calculator
 Percentage Calculator
 Compound Interest Calculator
  Loan Overpayment Calculator
 Mortgage Calculator
 Credit Card Calculator
 Investing
  Economics
 Trading
  Technical Analysis
  Personal Finance
 Calculator


