General Dynamics (GD) Fundamental and Technical Stock Analysis: Can the Defence Prime Keep Outperforming?
$364.70
04 Mar 2026, 12:54
Neutral

Join Minipip Academy and access free courses in investing, trading, economics, and more.
Sign Up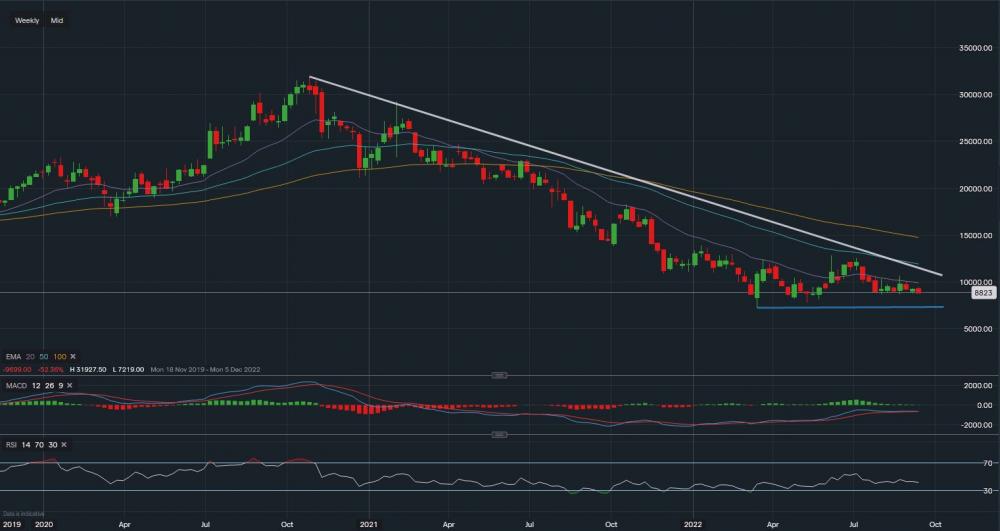
The stock is currently trading at $88.22, with highs ranging between $103-106 and lows between $82-86 in recent weeks. From a technical aspect, using a Fibonacci retracement tool a major support level sits at $72.19. A break below this level could see the stock test the very lows of May 2016 ($59). RSI is slightly negative as it reads 41.5 but MACD is showing a neutral stance, suggesting a stabilised position. Looking towards the upside, initial short-term resistance sits at $106 where the stock struggled to break higher (white trendline). In a mid to long-term outlook, a break above this level may possibly see the stock test the next tough resistance level at $130, which is where the 23.6% Fib level sits. If the stock broke above the 23.6% retracement point, a chance to gain recovery would open up as the uptrend could continue towards the 38.2% retracement at $166. Major risks do weigh on this stock as inflationary pressures will squeeze the market. The stock is under pressure and a drop back to the lows $72.19 looks very possible. Though it could provide a long-term buying opportunity.

Tradable assets:
Min.Deposit:
Max Leverage:
FCA:

Rating:


 Earnings Calendar
  Economic Calendar
  VAT Calculator
  Tax Free Childcare Calculator
 Percentage Calculator
 Compound Interest Calculator
  Loan Overpayment Calculator
 Mortgage Calculator
 Credit Card Calculator
 Investing
  Economics
 Trading
  Technical Analysis
  Personal Finance
 Calculator


