AbbVie (ABBV) Stock Analysis: Humira Decline, New Drug Growth, and Technical Consolidation
$228.47
06 Mar 2026, 17:58
Neutral

Join Minipip Academy and access free courses in investing, trading, economics, and more.
Sign Up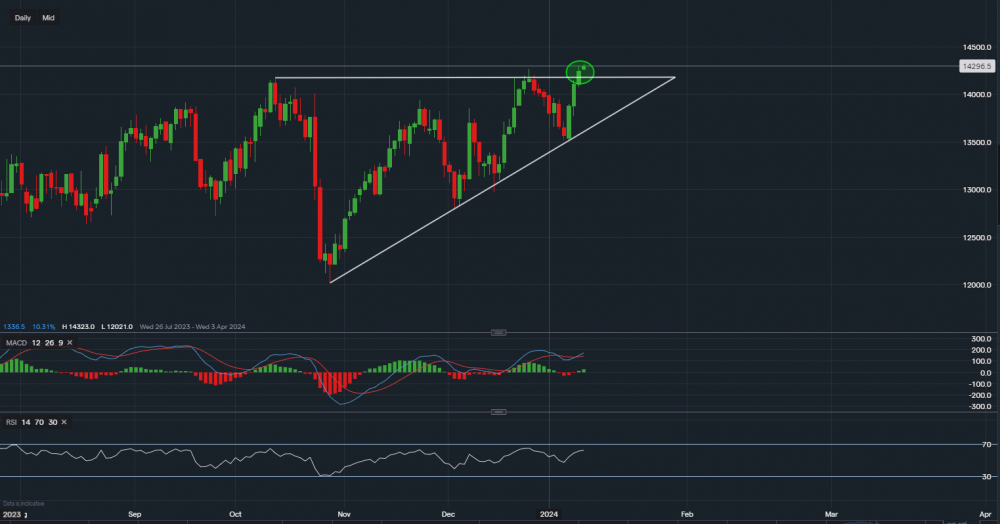
Chart & Data from IG
Taking a look at Alphabet as it penetrated through the resistance of $141.73 yesterday. Its share price closed above at $142.41 a share and its continuing to rise ahead of the CPI data due at 13:30 GMT. In theory, the break higher is a bullish indication, however, the risk remains elevated with the possibility of US inflation coming in hotter than expected. The previous resistance of $141.73 has now turned to support, a close below it could see the price fall back into the ascending triangle. Further support sits at $149.74 (yesterday’s low) and then a key level at $137.32 (along the ascending trendline). If Alphabet continues to rise, it will then face resistance at $145.21 followed by the all-time high of $153.35. The technical indicators on the daily interval have now turned positive once again, with the MACD line crossing over its signal line and the RSI on the rise, reading 62. However, traders and investors should be cautious as negative data could see yet another pullback.

Tradable assets:
Min.Deposit:
Max Leverage:
FCA:

Rating:


 Earnings Calendar
  Economic Calendar
  VAT Calculator
  Tax Free Childcare Calculator
 Percentage Calculator
 Compound Interest Calculator
  Loan Overpayment Calculator
 Mortgage Calculator
 Credit Card Calculator
 Investing
  Economics
 Trading
  Technical Analysis
  Personal Finance
 Calculator


