General Dynamics (GD) Fundamental and Technical Stock Analysis: Can the Defence Prime Keep Outperforming?
$364.70
04 Mar 2026, 12:54
Neutral

Join Minipip Academy and access free courses in investing, trading, economics, and more.
Sign Up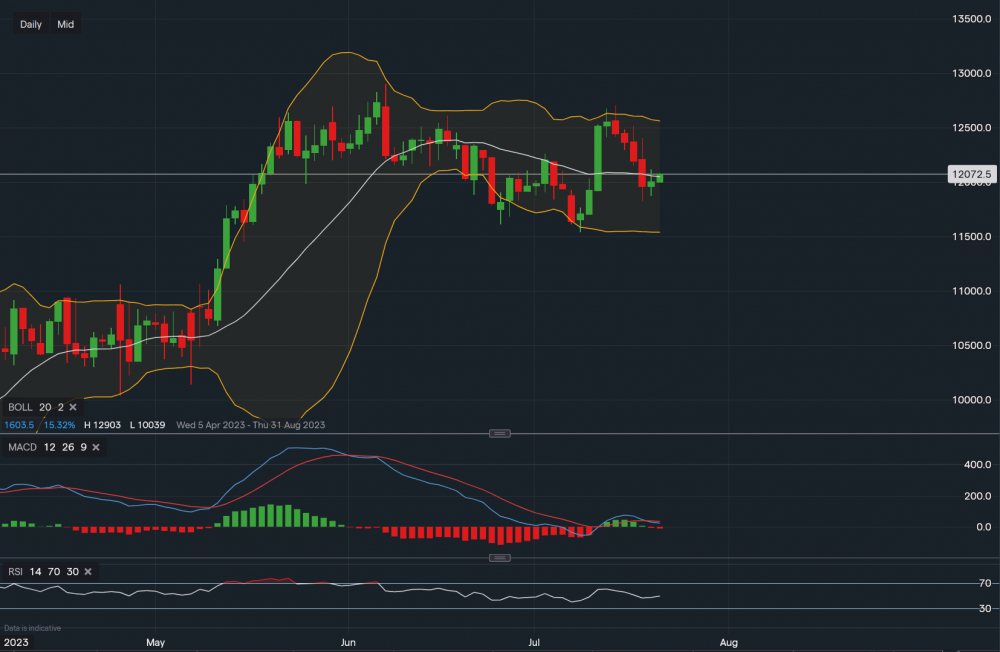
Chart & Data from IG
Alphabet is trading at around $120.72 a share. We can see the price has been trading sideways while gradually falling since the 7th of June, we had a test of the lower Bollinger Band ($115.86) before a push higher across both the 13th and 14th of July towards the upper Bollinger Band ($126.33). Since then, the price has once again retraced, correcting before the earnings report. At present, it is resting just above the middle moving average of the Bollinger bands, a close above this moving average could be a sign of consolidation. Though this will be massively influenced by the earnings and future outlook. For the time being, resistance sits at $121.20 then at $122.60. A break above $122.60 could then potentially see a push back up towards the upper Bollinger Band ($125.62). Whereas support levels sit at $118.23 then at $116.13 and then at $115.38. A break and close below $115.13 could then open the possibility of a move lower to as low as $110. However, such a fall after the AI boom and the US economy's improvement could only be possible if we saw a huge sell-off, raised recession fears, and extremely poor earnings. Looking at the technical indicators, MACD is slightly negative as a result of last week's negative closing, but the RSI is neutral as it reads 49. Alphabet is expected to report an EPS of $1.34 on revenue of $72.82bn.


 Earnings Calendar
  Economic Calendar
  VAT Calculator
  Tax Free Childcare Calculator
 Percentage Calculator
 Compound Interest Calculator
  Loan Overpayment Calculator
 Mortgage Calculator
 Credit Card Calculator
 Investing
  Economics
 Trading
  Technical Analysis
  Personal Finance
 Calculator


