General Dynamics (GD) Fundamental and Technical Stock Analysis: Can the Defence Prime Keep Outperforming?
$364.70
04 Mar 2026, 12:54
Neutral

Join Minipip Academy and access free courses in investing, trading, economics, and more.
Sign Up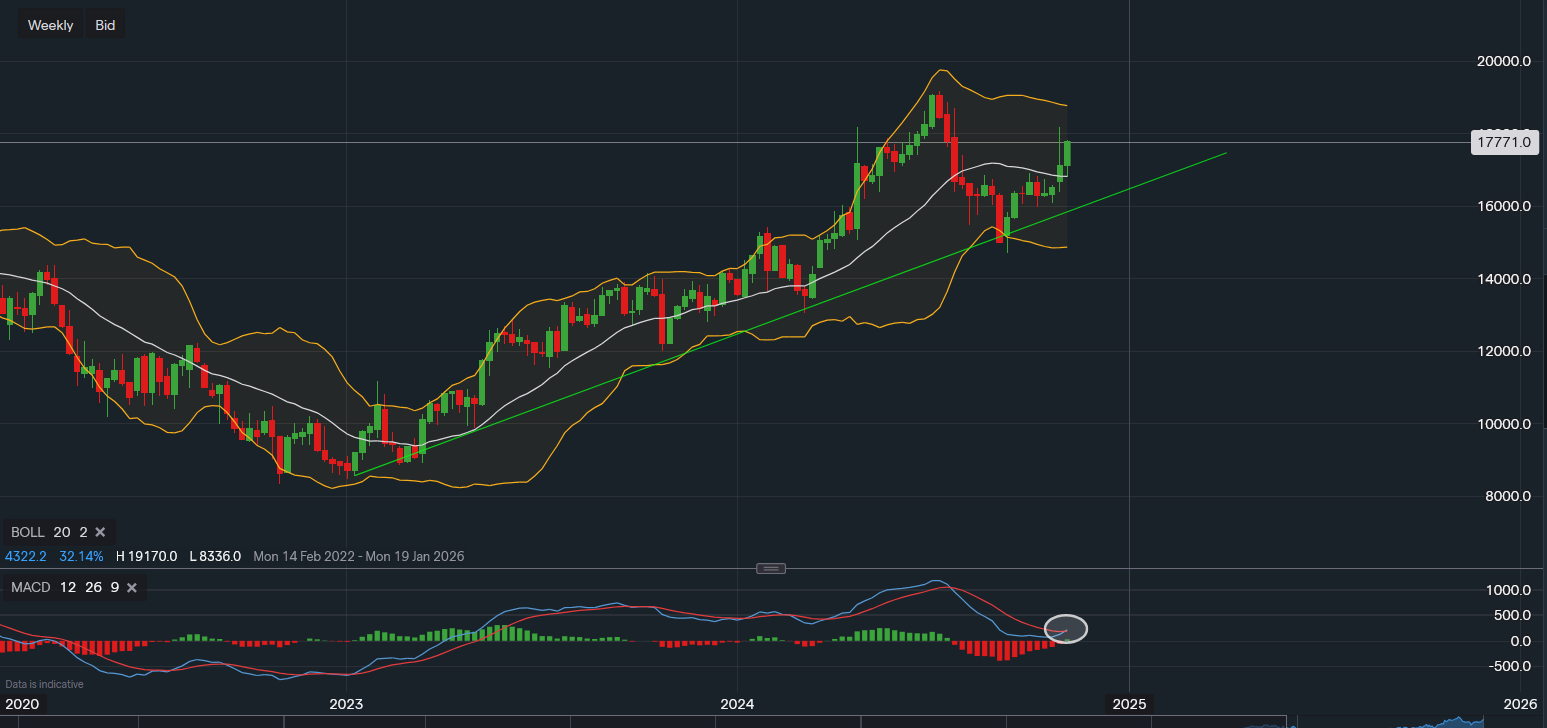
Chart & Data from IG
Alphabet appears positioned for a potential rally, as indicated by the bullish setup on the weekly chart. In the pre-market, shares are trading at approximately $177.71, up nearly 0.8% following a 4% rise yesterday. This positive momentum, coupled with technical indicators, signals that Alphabet could be on the verge of reaching new highs.
Using Bollinger Bands, the recent price action has confirmed a strong move above the middle band, highlighting the first resistance level at $181.93. If Alphabet’s stock price surpasses this point, the next target is the all-time high of $191.70, which aligns closely with the upper Bollinger Band. This level may serve as a potential target for traders and investors as bullish momentum builds.
In case of any pullback, the middle Bollinger Band’s moving average should provide initial support, estimated at around $167-$168. Below this, additional support lies at the $162-$163 level, where a green trendline has provided consistent support since January 2023. These levels are critical to watch for any market fluctuations, as they can help guide potential entry or exit points for investors.
The MACD indicator is also showing signs of turning bullish, marking a possible reversal that hasn’t been seen since July. This shift further supports the case for an upward trend in the near term, reinforcing the likelihood of continued gains if resistance levels are broken.
With solid technical support levels, a bullish MACD signal, and positive movement along the Bollinger Bands, Alphabet’s stock is well-positioned for potential growth. Investors and traders should watch for further confirmation of this upward trend as it nears key resistance levels, making Alphabet a compelling stock to consider for the coming weeks.

Tradable assets:
Min.Deposit:
Max Leverage:
FCA:

Rating:


 Earnings Calendar
  Economic Calendar
  VAT Calculator
  Tax Free Childcare Calculator
 Percentage Calculator
 Compound Interest Calculator
  Loan Overpayment Calculator
 Mortgage Calculator
 Credit Card Calculator
 Investing
  Economics
 Trading
  Technical Analysis
  Personal Finance
 Calculator


