General Dynamics (GD) Fundamental and Technical Stock Analysis: Can the Defence Prime Keep Outperforming?
$364.70
04 Mar 2026, 12:54
Neutral

Join Minipip Academy and access free courses in investing, trading, economics, and more.
Sign Up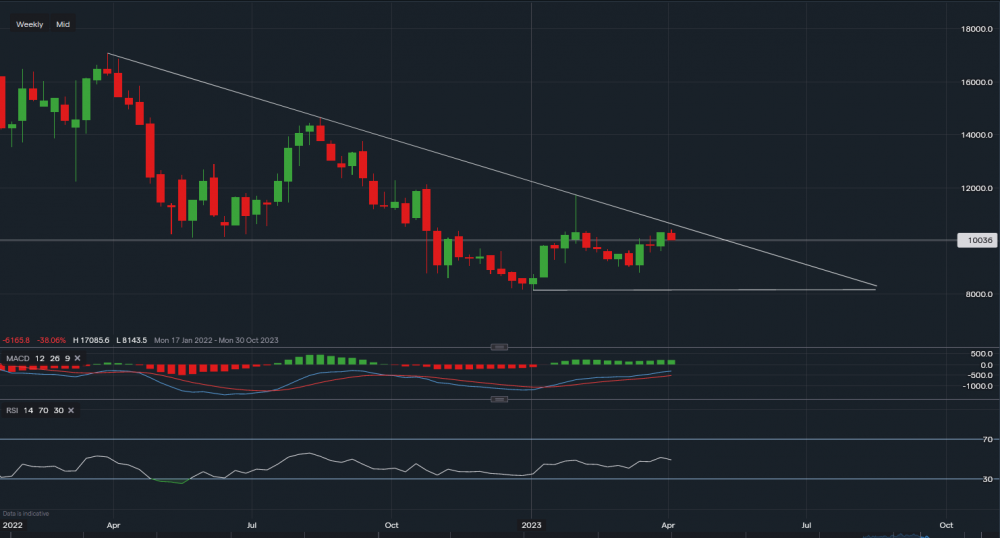
Chart & Data from IG
From a technical perspective, Amazon is currently trading at around $100.36 a share. We can see that since January the stock has tried to break out of the bearish trend on the weekly interval, but the resistance was overpowering (30th Jan). Now approaching the descending trendline once more could potentially re-test the resistance as early as this month. Resistance along the trendline is sitting at $104.69. Only a break and close above the trendline may see Amazon’s stock price edge higher towards the $117 level seen at end of January. Towards the downside, support sits at $99.01 followed by $96.29. A dip below this price could see a further retracement towards $88.12. Looking at the technical indicators, MACD is still slightly positive with RSI neutral as it reads 49.


 Earnings Calendar
  Economic Calendar
  VAT Calculator
  Tax Free Childcare Calculator
 Percentage Calculator
 Compound Interest Calculator
  Loan Overpayment Calculator
 Mortgage Calculator
 Credit Card Calculator
 Investing
  Economics
 Trading
  Technical Analysis
  Personal Finance
 Calculator


