General Dynamics (GD) Fundamental and Technical Stock Analysis: Can the Defence Prime Keep Outperforming?
$364.70
04 Mar 2026, 12:54
Neutral

Join Minipip Academy and access free courses in investing, trading, economics, and more.
Sign Up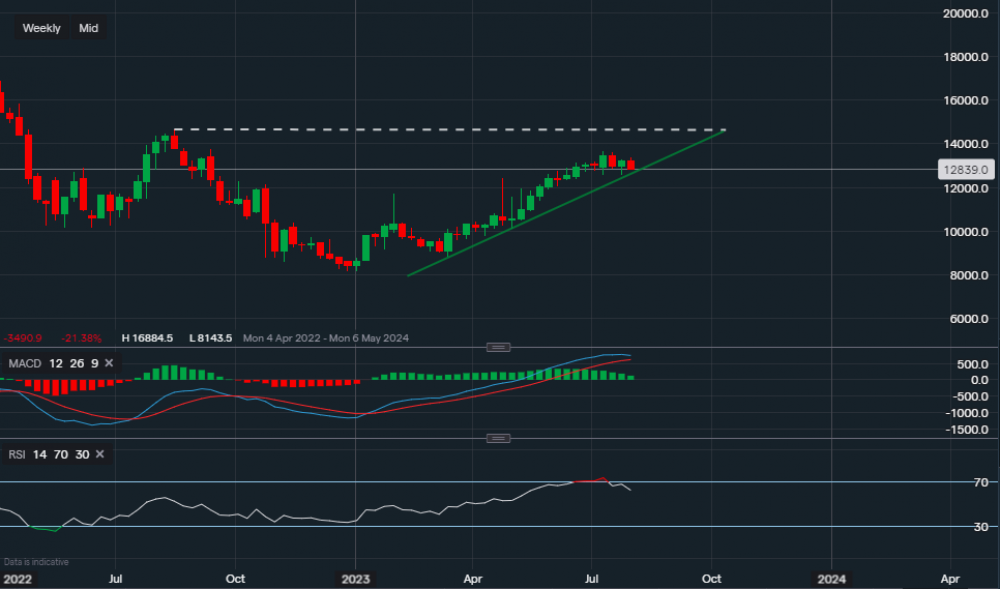
Chart & Data from IG
Amazon currently trading at around $128.39 a share. Looking at the weekly timeframe, we can see that some profit-taking is happening, as well as a slight retracement from weeks in the green. There is support along the green trendline at $125.93, a break and close below this could indicate that a further retracement might take place. If that was the case, we would then look at support levels sitting at $123.66 followed by $120.64. On the other hand, a bounce of the trendline could see the price continue higher towards resistance sitting at $132.12 and then the high of the year - $136.64. A confident move above the high would create the opportunity for a rise higher towards the key level at $146.56. Looking at the technical indicators, MACD is still positive but looks like it’s starting to curve, and the RSI is faltering as it now reads 62. This is not necessarily an indication that a big bearish trend is forming, for example, the weekly MACD tends to be more sensitive than the monthly. As a result, it can be more deceiving and only indicate a short-term move. The monthly MACD is still positive. Additionally, it is not a total surprise that some downside is occurring as we could see that the stock has been overbought for the past 4 weeks, as suggested by the RSI.


 Earnings Calendar
  Economic Calendar
  VAT Calculator
  Tax Free Childcare Calculator
 Percentage Calculator
 Compound Interest Calculator
  Loan Overpayment Calculator
 Mortgage Calculator
 Credit Card Calculator
 Investing
  Economics
 Trading
  Technical Analysis
  Personal Finance
 Calculator


