AbbVie (ABBV) Stock Analysis: Humira Decline, New Drug Growth, and Technical Consolidation
$228.47
06 Mar 2026, 17:58
Neutral

Join Minipip Academy and access free courses in investing, trading, economics, and more.
Sign Up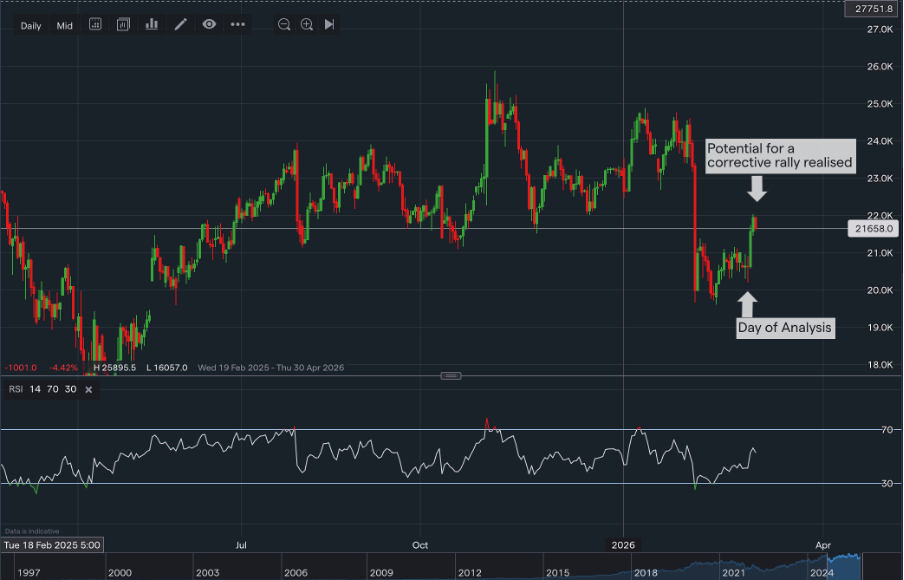
Amazon (NASDAQ: AMZN) Stock Analysis: Is Fundamental Strength Enough to Overcome a Bearish Technical Structure?
At a current share price of $206.76 and a market capitalisation of approximately $2.237 trillion, Amazon remains one of the most systemically important equities in global markets.
Trading on the Nasdaq with daily volume around 45.9 million shares, the company has 9.72 billion shares outstanding and a free float of roughly 10.73 billion shares, reflecting its deep institutional participation and liquidity.
Fundamental Analysis
From a valuation perspective, Amazon currently trades on a trailing P/E of 29.06 and a forward P/E of 22.12, producing an average multiple of 25.59. With trailing twelve-month earnings of $77.67 billion and projected earnings of $101.13 billion, the forward outlook reflects a substantial acceleration in profitability. EPS is expected to rise from 7.17 to 9.42, representing approximately 32.4% year-on-year growth. At a current market capitalisation of $2.237 trillion, applying the average P/E to projected earnings generates an implied valuation of $2.588 trillion, suggesting 15.7% theoretical upside from present levels.
The compression of forward P/E indicates that the market anticipates margin expansion rather than multiple expansion. In other words, the growth narrative is earnings-driven, not purely sentiment-driven.
The projected 30%+ expansion in earnings is underpinned by several structural drivers: stabilising AWS margins following prior cost optimisation cycles, disciplined retail cost management after years of heavy capital expenditure, continued high-margin advertising growth within the marketplace ecosystem, and the progressive monetisation of AI infrastructure investments. Together, these factors support the thesis that Amazon is preparing to transition from a reinvestment-heavy phase into a more operationally leveraged earnings cycle.
Analyst Consensus & Market Expectations
Wall Street sentiment toward Amazon remains highly constructive. Among 43 covering analysts, the consensus rating stands at Strong Buy, with 40 buy recommendations, no holds, and only three sells. The average price target of $282.21 implies approximately 26.4% upside from current levels, while the high target of $325 suggests significant potential if earnings acceleration exceeds expectations. Even the low target of $175 reflects limited pessimism relative to the broader analyst range. This alignment indicates that institutions generally expect continued growth, particularly if AWS successfully monetises AI infrastructure investments and sustains margin expansion.
Risks
Despite the constructive earnings outlook, Amazon faces a complex and multi-faceted risk profile; the company operates under heavy regulatory scrutiny in both the United States and the European Union. Ongoing FTC litigation and international investigations into market dominance, pricing practices, and competitive conduct introduce headline risk and potential operational constraints, especially since the $2.5 billion settlement, which it reached with the FTC in September 2025, over ‘dark pattern’ practices that tricked consumers into Prime subscriptions.
Additionally, Amazon’s substantial capital expenditure on AI infrastructure raises the risk of delayed returns should AI revenue fail to match investment intensity in a competitive bubble alongside Microsoft (Azure) and Alphabet (Google Cloud).
Geopolitical exposure adds another layer of uncertainty. Recent drone-related disruptions to data centres in the Middle East follwoing to the outbreak of the Iran war initiated by the USA and Israel, have highlighted infrastructure concentration risks within AWS operations.
Technical Analysis (Multi-Indicator Confirmation Framework)
From a price action perspective, Amazon is trading at $206.76 at the time of writing, slightly above VWAP at 205.82. While trading above VWAP can suggest short-term participation in the prevailing move, it does not override the broader bearish structure evident across multiple trend indicators. The EMA alignment is clearly negative: the 20 EMA (212.41) sits below the 50 EMA (220.82), which in turn sits below the 200 EMA (221.53). This 20 < 50 < 200 configuration reflects a fully stacked bearish trend structure. Importantly, price is trading below all three moving averages, meaning former support levels have transformed into resistance. This confirms that the current move is not a reversal signal within a downtrend, but a confirmed continuation where rallies are likely to be sold into unless a reclaim of key moving averages occurs.
Directional Movement Index (DMI) and ADX readings strengthen the bearish interpretation. With +DI at 14.84 and -DI at 28.07, sellers remain dominant. ADX at 28.63 signals that the trend is established. The MACD, however, introduces nuance, which remains negative (-5.66) and below zero, confirming the broader downtrend while the histogram has turned positive (+1.004), suggesting short-term bullish momentum – a potential corrective rally on the horizon.
Momentum oscillators remain consistent with this interpretation. RSI at 40.37 sits within the bearish control zone (35–50), indicating that the stock is not yet oversold and may have further downside before exhaustion.
On a multi-timeframe basis, the daily chart reflects a bearish rally, where sellers continue to push into strength, particularly near the opening prices. The weekly timeframe shows consolidation, implying equilibrium between buyers and sellers at higher levels. The monthly chart reveals two unfilled bearish fair value gaps dating back to early February, which may continue to act as magnets for price action.
In summary, the short-term technical bias remains bearish, the medium-term picture is neutral-to-consolidative, and the long-term structure remains broadly bullish but currently in a corrective mode. Unless price reclaims the 220–222 resistance levels decisively, probability favours bearish continuation.
Final Conclusion
Amazon currently represents a fundamentally bullish but technically weak configuration. Valuation models suggest 15–26% upside based on projected earnings and analyst targets, yet price action reflects an established downtrend with persistent resistance between 214 and 222. Until that zone is reclaimed with structural confirmation, the near-term bias remains bearish to neutral.
Disclaimer
This content is for educational and informational purposes only and should not be considered financial advice. Always conduct independent research or consult a qualified financial professional before making investment decisions.

Tradable assets:
Min.Deposit:
Max Leverage:
FCA:

Rating:


 Earnings Calendar
  Economic Calendar
  VAT Calculator
  Tax Free Childcare Calculator
 Percentage Calculator
 Compound Interest Calculator
  Loan Overpayment Calculator
 Mortgage Calculator
 Credit Card Calculator
 Investing
  Economics
 Trading
  Technical Analysis
  Personal Finance
 Calculator


