General Dynamics (GD) Fundamental and Technical Stock Analysis: Can the Defence Prime Keep Outperforming?
$364.70
04 Mar 2026, 12:54
Neutral

Join Minipip Academy and access free courses in investing, trading, economics, and more.
Sign Up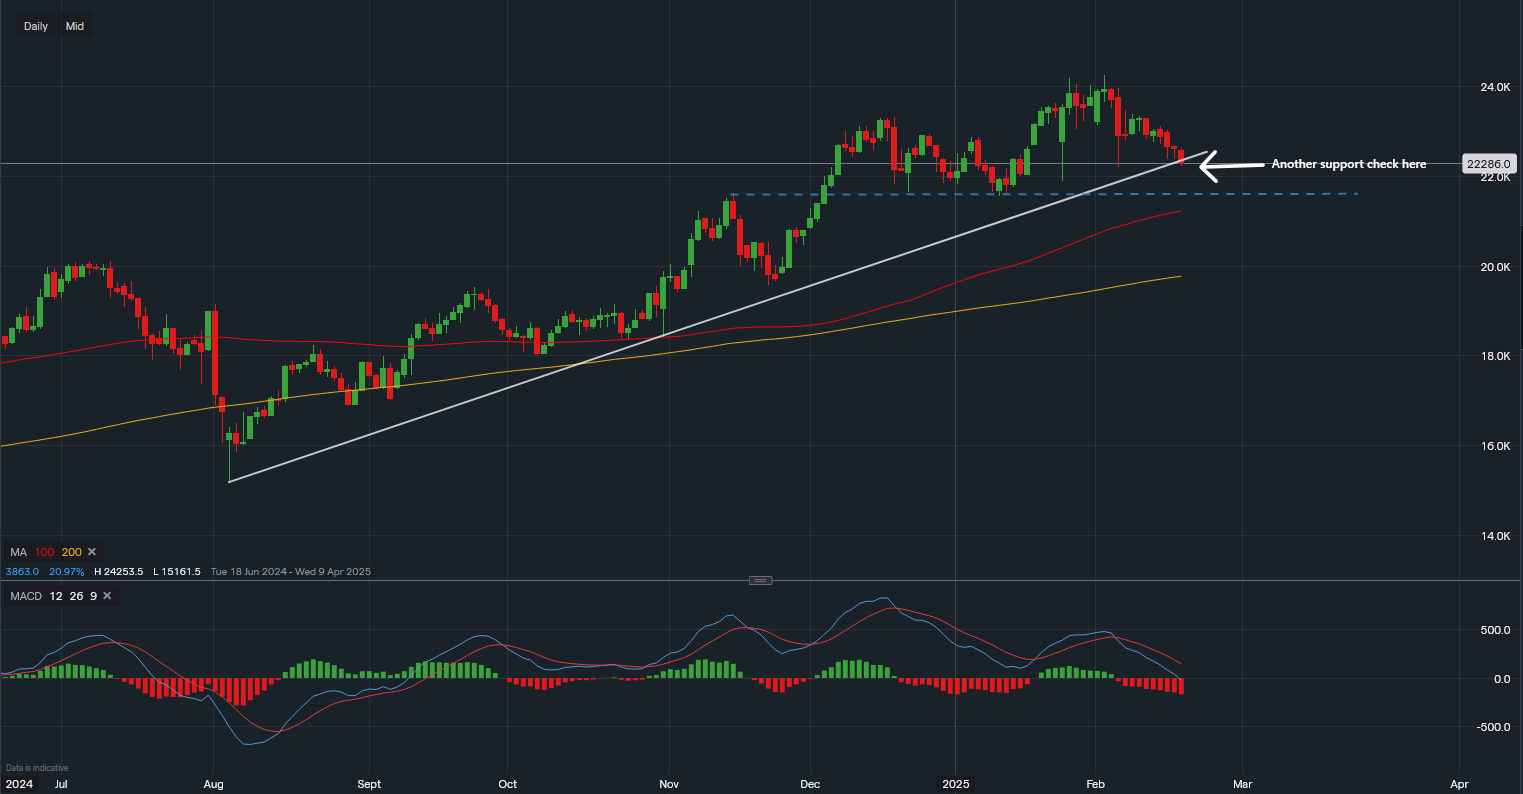
Chart & Data from IG
Amazon's stock price is currently testing a critical support level, aligning with its ascending technical trendline. Trading at approximately $222.86 per share, Amazon has pulled back from recent highs of $240. A break below this trendline could trigger further downside pressure, potentially pushing the stock down to $215-$216, where it would re-test January’s low (blue trendline).
The 100-day moving average (100MA) is currently at $212, aligning closely with the support level. This makes it a key price area to watch.
If Amazon fails to hold above $215, a deeper sell-off to around $200 could occur, bringing the 200-day moving average (200MA) into focus.
Momentum is shifting bearish, with the MACD indicator turning strongly negative and continuing to decline. This suggests that downside pressure may persist in the near term.
Immediate Support: $215-$216 (January’s low and 100MA alignment)
Deeper Support: $200 (200MA influence)
Resistance: $240 (recent highs)
The bias currently leans bearish, with downside momentum increasing. However, a successful defense of support levels could present an attractive entry point for long-term investors. We will closely monitor whether Amazon maintains its current support zone or breaks lower for further declines.

Tradable assets:
Min.Deposit:
Max Leverage:
FCA:

Rating:


 Earnings Calendar
  Economic Calendar
  VAT Calculator
  Tax Free Childcare Calculator
 Percentage Calculator
 Compound Interest Calculator
  Loan Overpayment Calculator
 Mortgage Calculator
 Credit Card Calculator
 Investing
  Economics
 Trading
  Technical Analysis
  Personal Finance
 Calculator


