General Dynamics (GD) Fundamental and Technical Stock Analysis: Can the Defence Prime Keep Outperforming?
$364.70
04 Mar 2026, 12:54
Neutral

Join Minipip Academy and access free courses in investing, trading, economics, and more.
Sign Up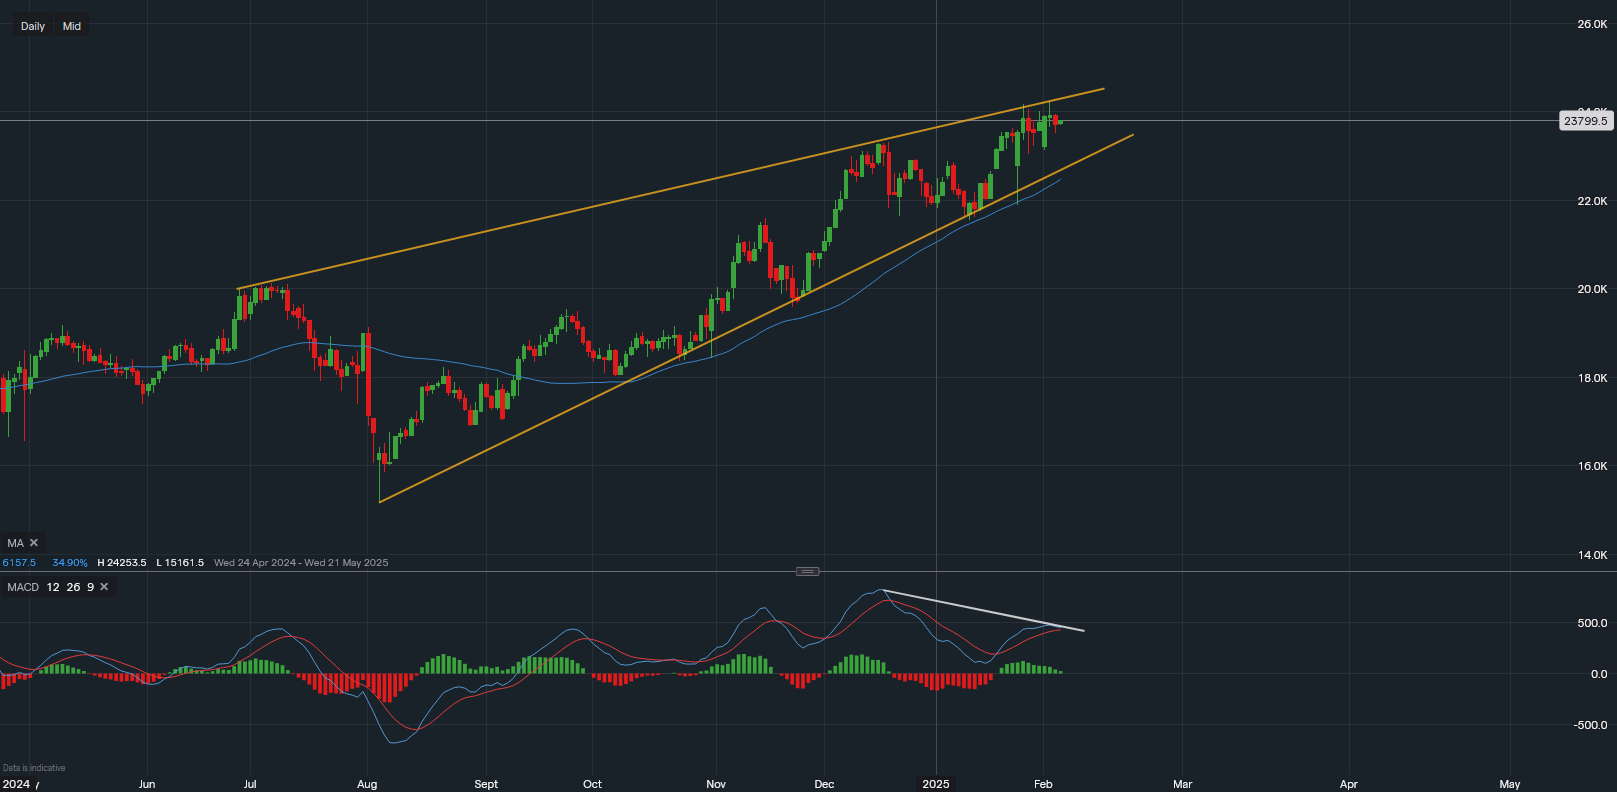
Chart & Data from IG
Amazon’s stock is in focus as investors anticipate its upcoming earnings report, set to be released later in the evening UK time. Technical indicators and key price levels suggest potential volatility, with both bullish and bearish signals influencing market sentiment.
Examining the daily chart, Amazon’s share price has been trading sideways since January 28, reflecting market caution as investors adjust their portfolios ahead of earnings.
There is strong resistance at $241-$242, as seen in two previous attempts to break higher (on January 28 and February 4). However, both times, Amazon’s stock was pushed back down, evident from the wicks on the daily candlesticks.
A break below $230 would put further downside pressure on the stock, with $227 acting as a crucial technical support level. Given its alignment with the 50-day moving average, this area will be closely monitored by traders if Amazon experiences a post-earnings decline.
One key technical factor to consider is the MACD (Moving Average Convergence Divergence) indicator, which measures recent price momentum.
Despite short-term technical concerns, Amazon remains a strong long-term investment according to Wall Street analysts.
Given Amazon’s strong fundamentals and bullish analyst ratings, any short-term dip following the earnings report could present a buying opportunity for long-term investors.
✅ Amazon stock is consolidating ahead of earnings, with key resistance at $241-$242 and support around $230-$227.
✅ MACD divergence suggests short-term caution, possibly leading to profit-taking.
✅ Wall Street remains bullish, with a 12-month target of $261.78.
✅ A post-earnings dip could be a buying opportunity for investors with a long-term outlook.

Tradable assets:
Min.Deposit:
Max Leverage:
FCA:

Rating:


 Earnings Calendar
  Economic Calendar
  VAT Calculator
  Tax Free Childcare Calculator
 Percentage Calculator
 Compound Interest Calculator
  Loan Overpayment Calculator
 Mortgage Calculator
 Credit Card Calculator
 Investing
  Economics
 Trading
  Technical Analysis
  Personal Finance
 Calculator


