General Dynamics (GD) Fundamental and Technical Stock Analysis: Can the Defence Prime Keep Outperforming?
$364.70
04 Mar 2026, 12:54
Neutral

Join Minipip Academy and access free courses in investing, trading, economics, and more.
Sign Up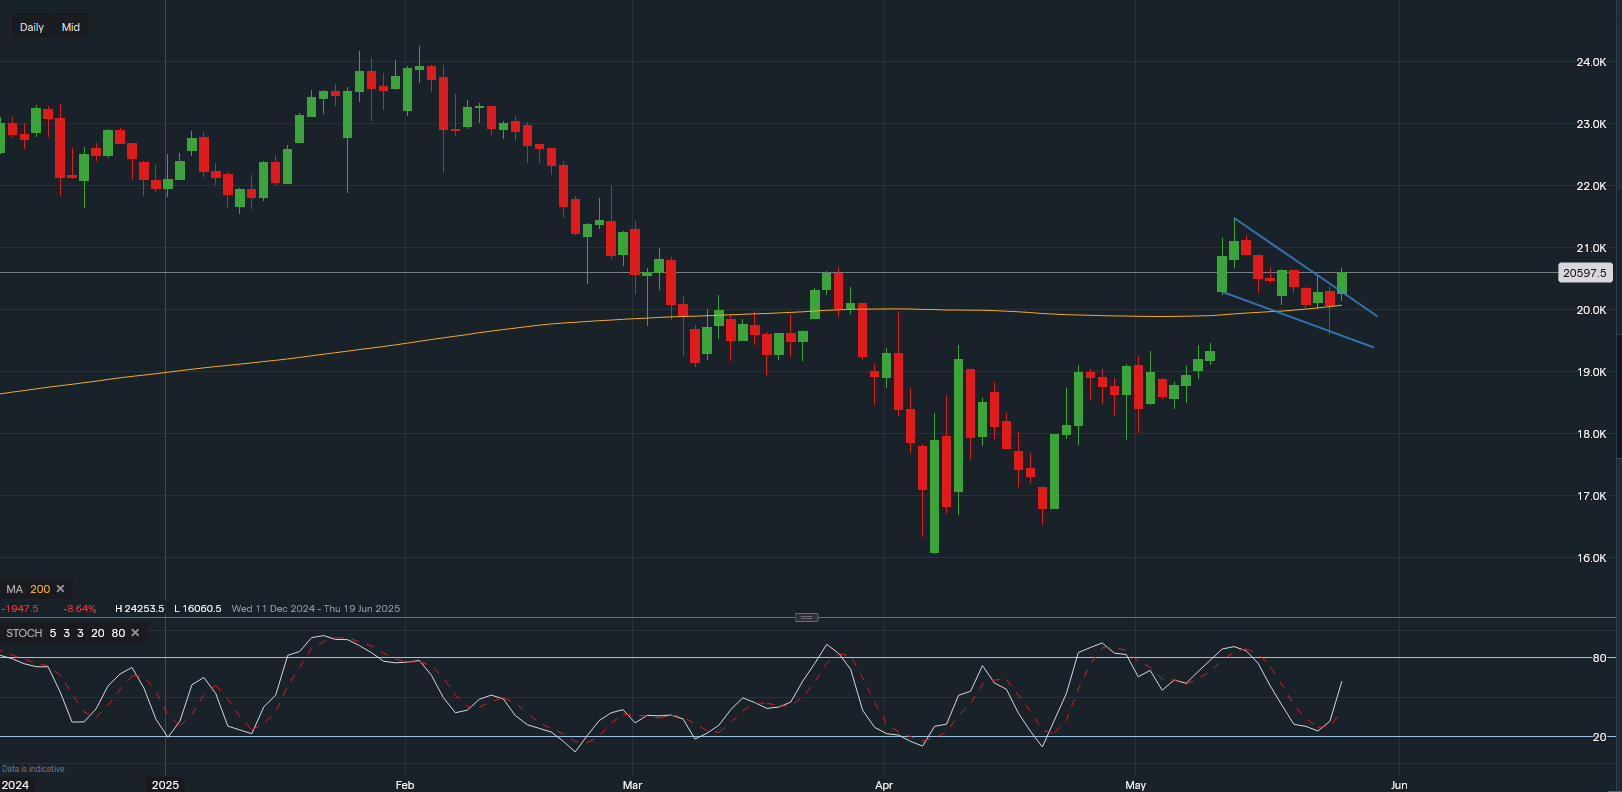
Chart & Data from IG
Amazon.com Inc. (AMZN) is showing signs of a potential bullish breakout on the daily chart, as the stock attempts to emerge from a classic bullish flag pattern. Currently, Amazon shares are trading around $205.97, following a successful test of the 200-day moving average (200MA) — a key technical support level that is reinforcing the case for further upside.
The 200-day moving average, now positioned at $200.75, has proven to be a crucial support area. The bounce from this level has helped sustain bullish momentum, putting the next resistance target at $214.82 in focus. A clear breakout above $214.82 could pave the way for a move towards the next major resistance at $219.93.
On the downside, a break below the 200MA could shift the bias to bearish, potentially triggering an attempt to fill the price gap left on 9 May. For this to occur, Amazon’s share price would need to first breach the 23 May low of $196.02, with the gap closing near $193.
From a momentum standpoint, the Stochastic Oscillator is currently trending higher, which may support Amazon’s share price in the short term. A continued uptick in momentum could strengthen the breakout scenario and encourage further buying interest.
Conclusion: Amazon stock is at a pivotal point technically, with a potential bullish flag breakout forming above key support. Traders should monitor the price action closely around the $214.82 resistance and 200-day MA support at $200.75, while watching for continued signals from the Stochastic Oscillator.

Tradable assets:
Min.Deposit:
Max Leverage:
FCA:

Rating:


 Earnings Calendar
  Economic Calendar
  VAT Calculator
  Tax Free Childcare Calculator
 Percentage Calculator
 Compound Interest Calculator
  Loan Overpayment Calculator
 Mortgage Calculator
 Credit Card Calculator
 Investing
  Economics
 Trading
  Technical Analysis
  Personal Finance
 Calculator


