General Dynamics (GD) Fundamental and Technical Stock Analysis: Can the Defence Prime Keep Outperforming?
$364.70
04 Mar 2026, 12:54
Neutral

Join Minipip Academy and access free courses in investing, trading, economics, and more.
Sign Up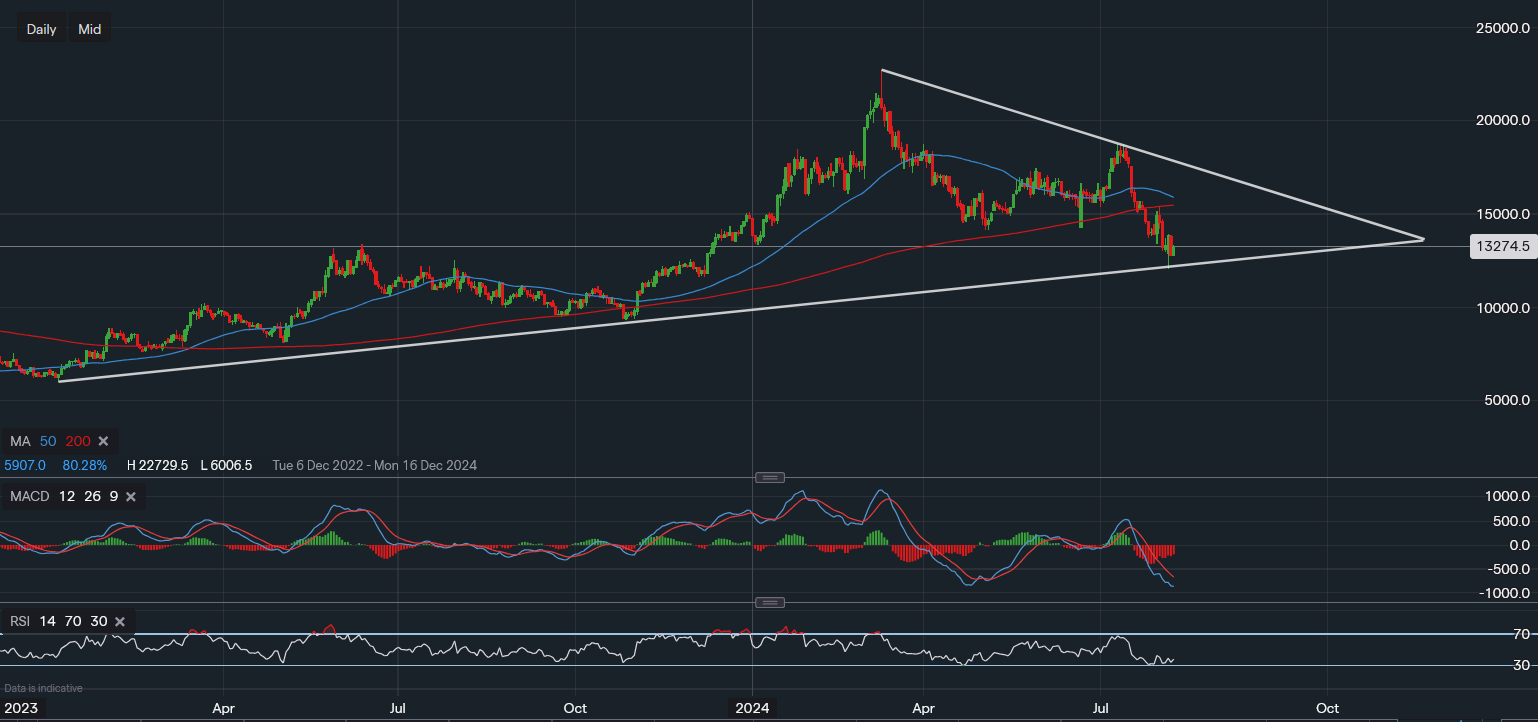
Chart & Data from IG
AMD’s price is now hovering above trendline support as the sell-off continues, this trendline should act as a base for the near-term, maybe even a bounce from this potentially current interim bottom as the US markets are trying to recover. The worrying factor in the shorter term is the current positioning of the moving averages, the 50MA is approaching the 200MA. If it manages to remain above, then consolidation could be the next stage. However, if it crosses below it, then this could lead to more volatility. The resistance along the descending trendline may cause some difficulty between $150-$160, on the other hand, a break above it may see an end to this bearish trend that began in early March. AMD’s shares are trading at around $132.74 a share with the following key levels towards the downside to keep an eye on, trendline support around $122. Followed by $120 and then $111-$110. Towards the upside, a move above $138-$139 would then see $150-$155 as the next area in focus. The technical indicators are showing greater optimism than the price action itself. The MACD looks like it’s starting to bottom out and there is a slight bullish divergence on the RSI as it grinds its way out of the oversold territory.

Tradable assets:
Min.Deposit:
Max Leverage:
FCA:

Rating:


 Earnings Calendar
  Economic Calendar
  VAT Calculator
  Tax Free Childcare Calculator
 Percentage Calculator
 Compound Interest Calculator
  Loan Overpayment Calculator
 Mortgage Calculator
 Credit Card Calculator
 Investing
  Economics
 Trading
  Technical Analysis
  Personal Finance
 Calculator


