AbbVie (ABBV) Stock Analysis: Humira Decline, New Drug Growth, and Technical Consolidation
$228.47
06 Mar 2026, 17:58
Neutral

Join Minipip Academy and access free courses in investing, trading, economics, and more.
Sign Up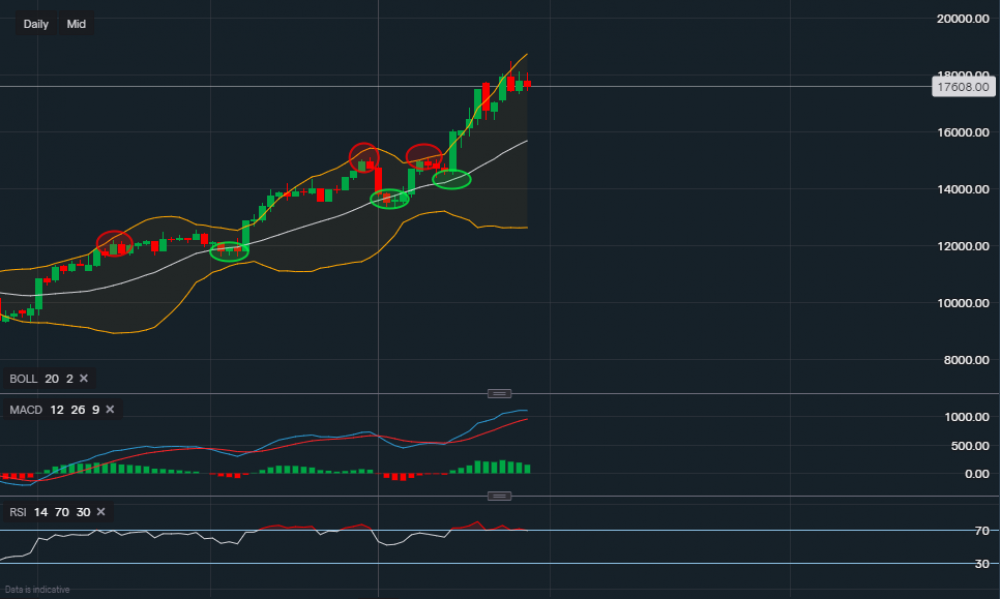
Chart & Data from IG
AMD’s shares are currently trading at around $176.08 a share ahead of its earnings tomorrow. The semiconductor company is expected to report an EPS of $0.77 on revenue of $6.13bn. Looking at the chart based on the daily timeframe, it is pretty self-explanatory when applying the Bollinger Bands. Current resistance is the all-time high point of $184.91, a break and close above it could see a push towards $190 a share. Whereas support sits at $173.34. Though this is a minor support level. As shown on the chart through the use of ovals, we can see that every time the price reaches the upper Bollinger Band, profit-taking occurs. Leading to a pullback towards the middle moving average of the Bollinger’s. This pattern seems similar throughout which is then followed by a push higher. However, this may not necessarily be the case this time around. The near-term outlook could be determined by the earnings outcome and future guidance, hence, caution should be in place. A break below $173.34 would then shift the focus towards $164.29. A move below $164.29 would increase the likelihood of yet another pullback towards the middle MA, which currently reads $156.87. Looking at the technical indicators, they are similar to many stocks out there right now. The MACD is positive although it is starting to curve. Whereas the RSI was oversold all of last week but now reads 68, it also looks like a small dip could be underway. Nevertheless, technical indicators are lagging indicators and should never be used alone for the determination of future price movement.

Tradable assets:
Min.Deposit:
Max Leverage:
FCA:

Rating:


 Earnings Calendar
  Economic Calendar
  VAT Calculator
  Tax Free Childcare Calculator
 Percentage Calculator
 Compound Interest Calculator
  Loan Overpayment Calculator
 Mortgage Calculator
 Credit Card Calculator
 Investing
  Economics
 Trading
  Technical Analysis
  Personal Finance
 Calculator


