General Dynamics (GD) Fundamental and Technical Stock Analysis: Can the Defence Prime Keep Outperforming?
$364.70
04 Mar 2026, 12:54
Neutral

Join Minipip Academy and access free courses in investing, trading, economics, and more.
Sign Up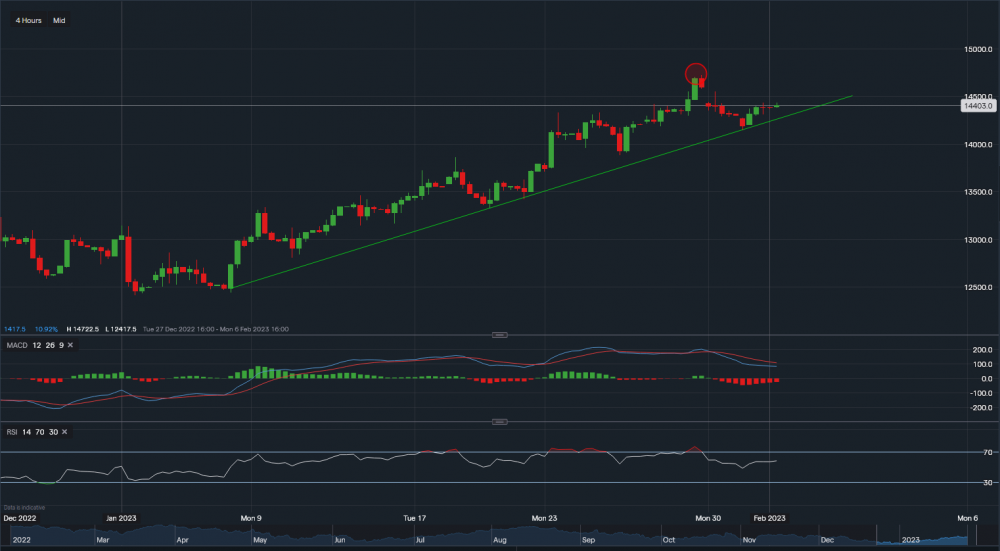
Apple - Chart & Data from IG
Financials
Despite concerns of a recession, sales have remained strong until 2022. A surge around Christmas time and the introduction of the new iPhone 14 models probably have contributed to the total revenue of $394 billion, up from $365 billion in 2021. Until October 2022, profit after tax was $99.8 billion, or 25.3% of revenue. The figures are pretty solid when looking at the balance sheet, as you would envision. As of October 2022, there was $48 billion in cash on hand with total assets reported at $352 billion, while total liabilities sat around $302 billion. Nevertheless, Apple’s cash on hand value declined and the increase in liabilities overshadowed the marginal rise in assets, hence, the equity of the company depreciated in value by almost $13bn.
Technicals
Looking at the chart, Apple’s (AAPL) shares are trading at around $144.03 a share. From a technical aspect, we can see that on the 4 hour interval the support has been established along the trendline. The first support level is sat on the trendline at $142.90, followed by lower support at $141.45. A break below $141.45 could see a further decline towards a key support level at $138.81. On the other hand, towards the upside, minor resistance sits at $145.54 which is followed by a major resistance point at $147.22 (marked by red oval). A break above the major point may see the price of Apple’s stock climb in the direction of $150. The technical indicators are mixed, MACD is negative but swaying towards neutral and RSI is positive as it reads 59.


 Earnings Calendar
  Economic Calendar
  VAT Calculator
  Tax Free Childcare Calculator
 Percentage Calculator
 Compound Interest Calculator
  Loan Overpayment Calculator
 Mortgage Calculator
 Credit Card Calculator
 Investing
  Economics
 Trading
  Technical Analysis
  Personal Finance
 Calculator


