AbbVie (ABBV) Stock Analysis: Humira Decline, New Drug Growth, and Technical Consolidation
$228.47
06 Mar 2026, 17:58
Neutral

Join Minipip Academy and access free courses in investing, trading, economics, and more.
Sign Up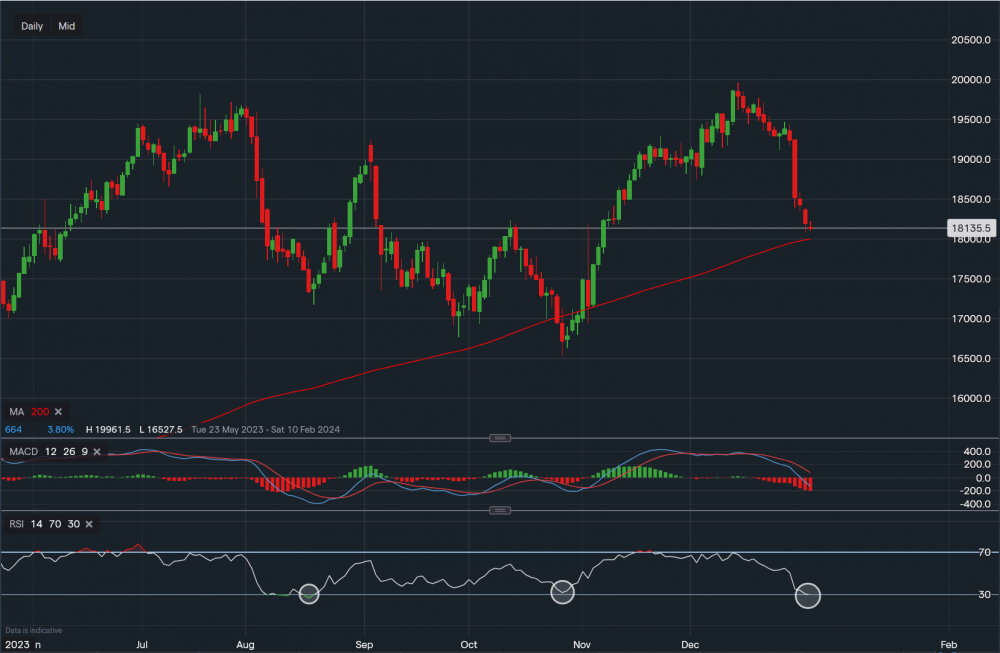
Chart & Data from IG
Taking a look at Apple here on the daily timeframe as it is approaching the 200-day moving average. Currently, its shares are trading at around $181.35 a share. The support along the 200-day MA reads $179.97, we can see that in October the price tested and fell below it but then bounced back resulting in a rally. Hence, there is a possibility that the support along the 200-day MA may have formed new resilience. A break below would not necessarily mean that a bounce is not possible as shown in the past, therefore, any consolidation around the moving average could result in a small bounce. If that scenario was to form, a conservative target would be between 2-3%. However, a close below the moving average could simply be a bearish indication that more downside is upcoming. Looking at the technical indicators, the MACD remains strongly bearish. However, if we look deeper into the RSI we can see that on the last two occasions when the RSI has suggested/came close to oversold conditions, a short-term bounce followed through. The RSI is now once again in oversold conditions as it reads 30.

Tradable assets:
Min.Deposit:
Max Leverage:
FCA:

Rating:


 Earnings Calendar
  Economic Calendar
  VAT Calculator
  Tax Free Childcare Calculator
 Percentage Calculator
 Compound Interest Calculator
  Loan Overpayment Calculator
 Mortgage Calculator
 Credit Card Calculator
 Investing
  Economics
 Trading
  Technical Analysis
  Personal Finance
 Calculator


