AbbVie (ABBV) Stock Analysis: Humira Decline, New Drug Growth, and Technical Consolidation
$228.47
06 Mar 2026, 17:58
Neutral

Join Minipip Academy and access free courses in investing, trading, economics, and more.
Sign Up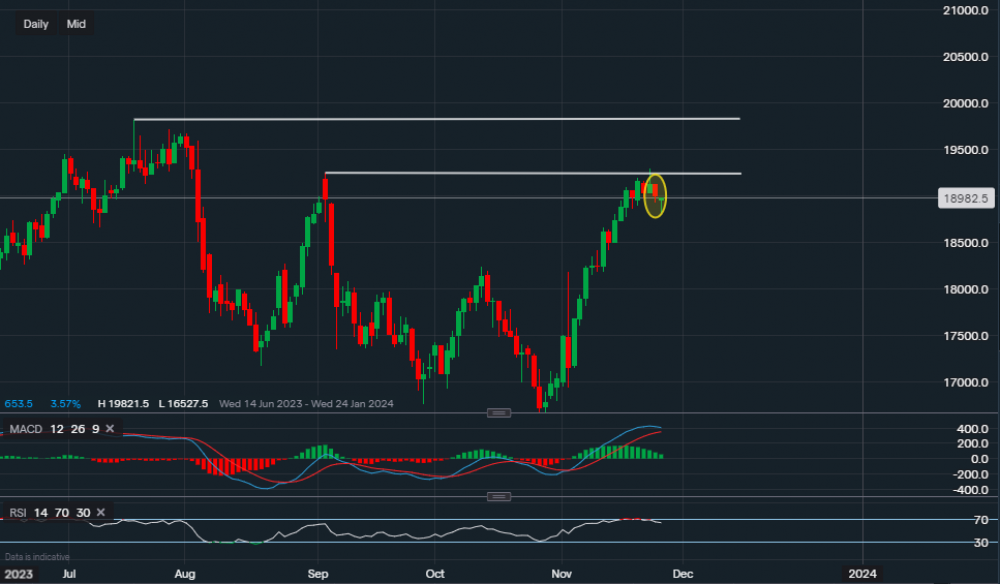
Chart & Data from IG
Apple’s stock closed lower on Friday than it opened on Thursday, as highlighted by the oval on the chart. This tends to be a bearish indication, perhaps some profit-taking may occur in the short term. We can also see that the price failed to close above the resistance of $192.83 on Thursday, supporting the view of a small pullback in the near term. Currently, its stock is trading at around $189.82 a share. Support sits at $188.58 and then at $187.71. A break and close below $187.71 could maybe then see a move lower towards around $185 a share. Key resistance remains at $192.83 and only a close above it would suggest that further upside is possible. If we look at the technical indicators, technically they are positive but the bearish signs are creeping in. The MACD is starting to curve with the volume gradually lowering and the RSI is also starting to curve downwards, reading 64.

Tradable assets:
Min.Deposit:
Max Leverage:
FCA:

Rating:


 Earnings Calendar
  Economic Calendar
  VAT Calculator
  Tax Free Childcare Calculator
 Percentage Calculator
 Compound Interest Calculator
  Loan Overpayment Calculator
 Mortgage Calculator
 Credit Card Calculator
 Investing
  Economics
 Trading
  Technical Analysis
  Personal Finance
 Calculator


