General Dynamics (GD) Fundamental and Technical Stock Analysis: Can the Defence Prime Keep Outperforming?
$364.70
04 Mar 2026, 12:54
Neutral

Join Minipip Academy and access free courses in investing, trading, economics, and more.
Sign Up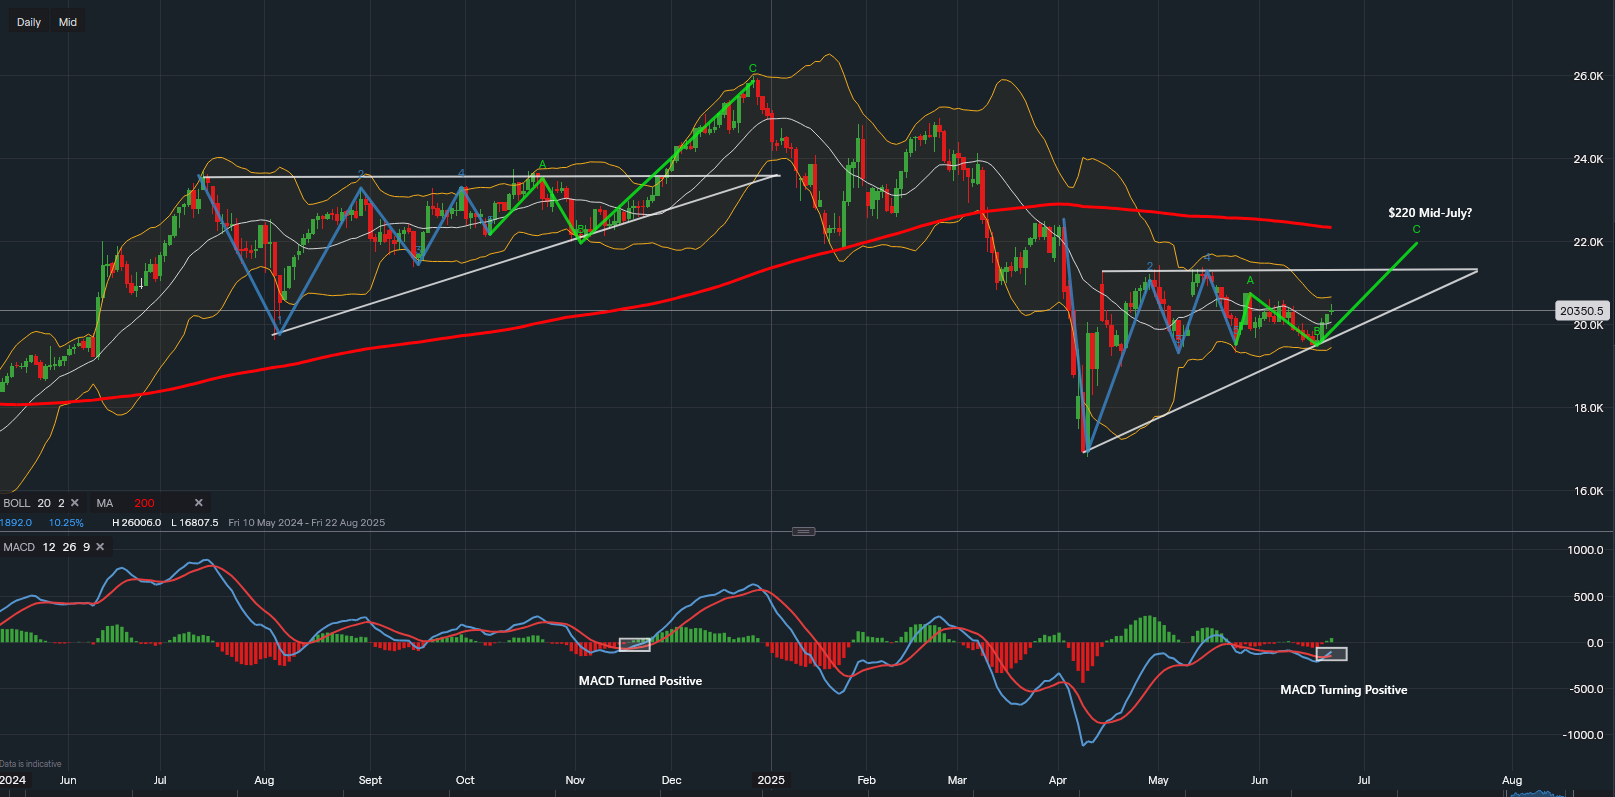
Chart & Data from IG
Apple Inc. (AAPL) stock is drawing attention as Bollinger Bands tighten, typically a precursor to a significant price move. Currently trading near $203.50 per share, Apple’s chart is showing early signs of bullish momentum, although the direction is not yet confirmed. Historically, a Bollinger Band squeeze often leads to an upside breakout, making this a key technical setup for traders to watch.
Several technical and seasonal factors suggest Apple may be poised for a near-term rally. July is traditionally a strong month for equities, and Apple stock trends have previously mirrored current chart patterns. Specifically, the price action appears similar to the July–November 2024 period, when Apple consolidated in a range before breaking higher following a Bollinger Band squeeze.
The stock has yet to retest its 200-day moving average since dropping below it on 10 March 2025. This mean-reversion dynamic could attract buyers looking for a rebound, especially if broader market sentiment improves. A move back to the 200-day average would imply a price target near $220 per share, representing an approximate 9–10% upside from current levels.
Beyond technicals, macroeconomic developments could fuel a bullish scenario for Apple:
Ceasefire optimism in the Middle East may reduce geopolitical risk, boosting investor sentiment.
The Federal Reserve is now increasingly expected to cut interest rates sooner rather than later—potentially stimulating tech stocks.
A critical trade deal deadline on 9 July could provide clarity on global tariffs, positively affecting multinational companies like Apple.
These developments could all converge just as the Q3 earnings season kicks off in July, giving Apple stock another potential boost.
From a momentum standpoint, the MACD (Moving Average Convergence Divergence) indicator is close to turning positive. A bullish crossover could signal renewed buying interest, driving the share price towards $214, where the upper trendline of the current wedge pattern offers technical resistance.
Current Price: $203.50
Upside Target 1: $214 (Resistance level)
Upside Target 2: $220 (200-day moving average)
Support Zone: $195–$198 (recent consolidation range)

Tradable assets:
Min.Deposit:
Max Leverage:
FCA:

Rating:


 Earnings Calendar
  Economic Calendar
  VAT Calculator
  Tax Free Childcare Calculator
 Percentage Calculator
 Compound Interest Calculator
  Loan Overpayment Calculator
 Mortgage Calculator
 Credit Card Calculator
 Investing
  Economics
 Trading
  Technical Analysis
  Personal Finance
 Calculator


