General Dynamics (GD) Fundamental and Technical Stock Analysis: Can the Defence Prime Keep Outperforming?
$364.70
04 Mar 2026, 12:54
Neutral

Join Minipip Academy and access free courses in investing, trading, economics, and more.
Sign Up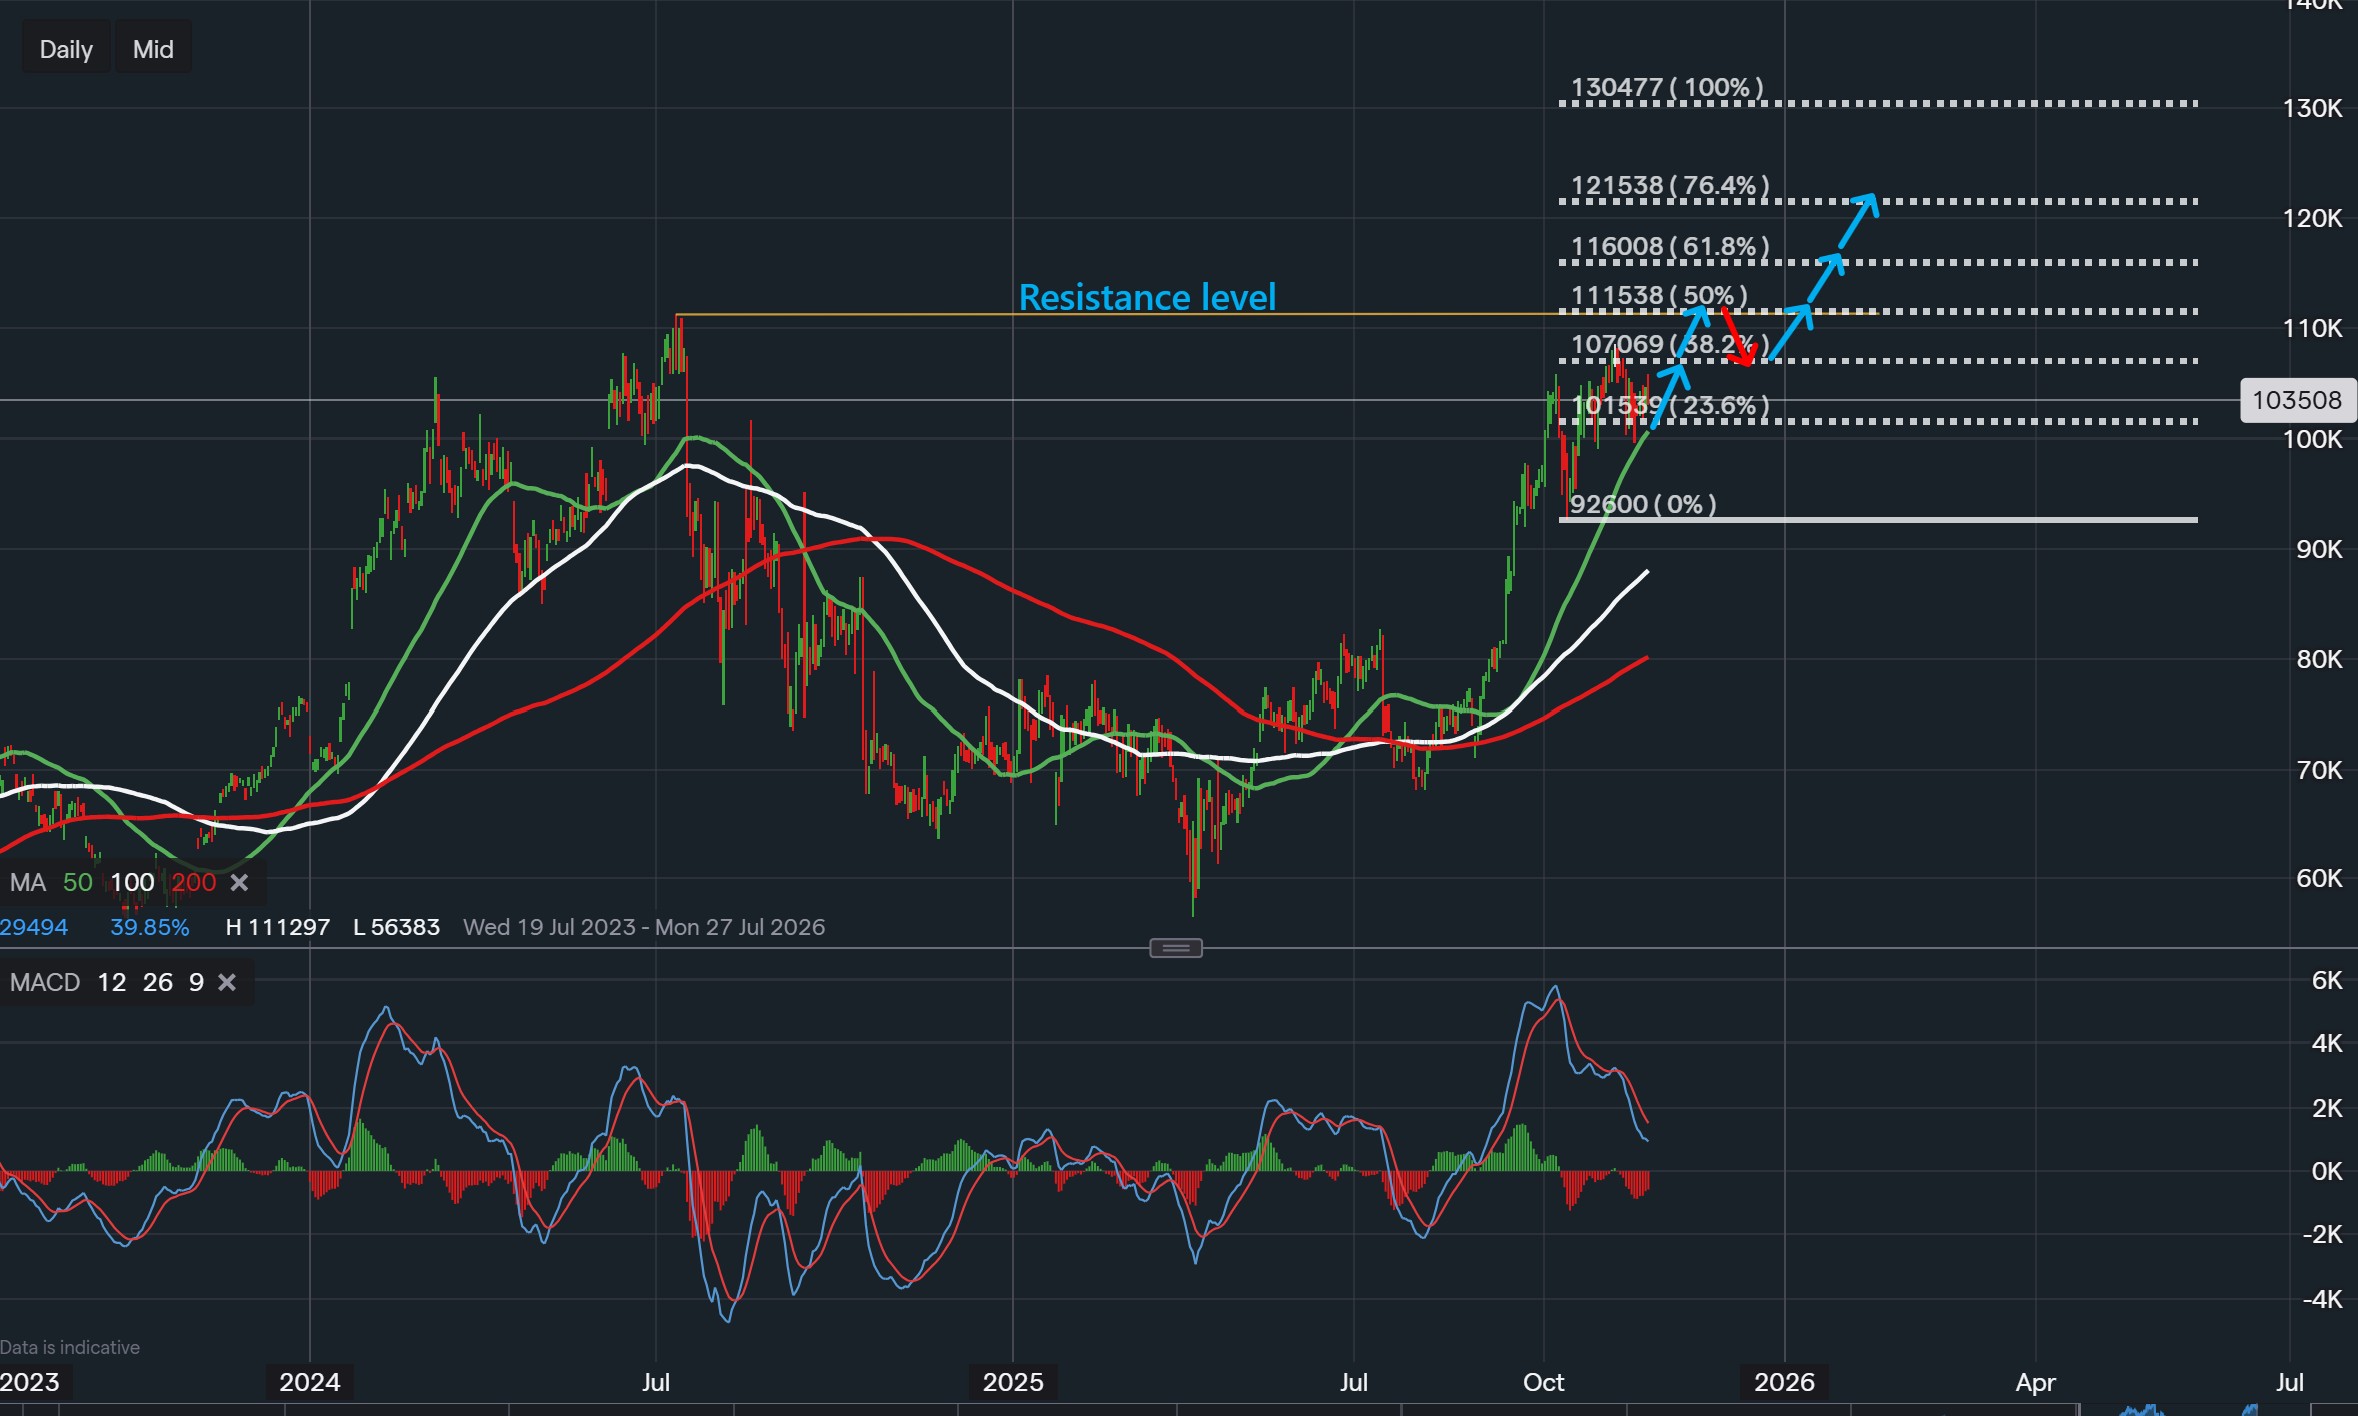
Data from IG - TimeFrame - Daily
Market Overview
ASML currently trades with a price-to-earnings (P/E) ratio of 38.80, while its forward P/E sits at 34.15. These figures indicate that the company is expected to remain profitable over the next 12 months, providing a solid foundation for both traders and long-term investors. Such valuations suggest that shareholders are paying a premium for a company with a strong earnings trajectory, reflecting confidence in ASML’s ongoing growth in the semiconductor equipment sector. Despite these favourable fundamentals, analyst confidence in the stock is somewhat muted, with an overall rating of 7. The majority of analysts still issue a Buy recommendation, though the more cautious sentiment may reflect market volatility and the high valuation relative to historical averages.
Technical Setup: Rebound Towards Previous Highs
Examining ASML’s daily chart, the stock has recovered from recent lows and is moving steadily toward its previous all-time high. This recovery indicates renewed buying interest and suggests that market participants are positioning for further upside. The price action appears to be forming the initial stages of a cup and handle pattern, a classic technical formation often associated with bullish continuation. The cup and handle pattern indicates that after a period of consolidation, the stock could experience a breakout that drives it to new highs.
Key Resistance: The 50% Fibonacci Level
The 50% Fibonacci retracement level aligns closely with ASML’s previous all-time high, creating a critical resistance point. If the stock manages to decisively break above this level, it could mark the beginning of a new upward leg in the trend. For traders, this breakout represents a potential entry opportunity, while investors may see it as confirmation of continued strength in ASML’s market performance. However, resistance levels of this nature often require sustained buying pressure to be overcome, making it essential to monitor volume and momentum indicators for confirmation.
Momentum Analysis: Caution Signals from MACD
While price action shows promise, momentum indicators suggest a more cautious outlook in the short term. The MACD is currently positioned below the signal line, and the histogram reflects bearish momentum. This indicates that, despite the upward price movement, the momentum has yet to fully align with the prevailing bullish trend. For the stock to sustain its recovery and complete the potential cup and handle formation, the MACD will need to realign with the trend. Traders and investors should watch for a crossover above the signal line, as it would indicate renewed bullish momentum and support the likelihood of a breakout.
Conclusion: Balanced Outlook for Traders and Investors
ASML presents an intriguing combination of strong fundamentals and a potentially constructive technical setup. Its solid P/E and forward P/E ratios suggest continued profitability, while the emerging technical patterns highlight possible upside opportunities. Momentum indicators warrant caution, but a realignment of the MACD could provide confirmation of a trend continuation. For traders, the stock may offer entry points around breakout levels, while long-term investors could view the setup as a signal of sustainable growth in ASML’s earnings and market position.
Disclaimer
This analysis is intended solely for educational and informational purposes. It does not constitute financial advice, investment guidance, or trading recommendations. Market conditions can change rapidly, and all investment decisions should be made based on individual research.

Tradable assets:
Min.Deposit:
Max Leverage:
FCA:

Rating:


 Earnings Calendar
  Economic Calendar
  VAT Calculator
  Tax Free Childcare Calculator
 Percentage Calculator
 Compound Interest Calculator
  Loan Overpayment Calculator
 Mortgage Calculator
 Credit Card Calculator
 Investing
  Economics
 Trading
  Technical Analysis
  Personal Finance
 Calculator


