NVIDIA Share Price Analysis: Market Consolidation Ahead of a Potential Bullish Rally
$187.22
30 Dec 2025, 23:28

AstraZeneca PLC - Chart & Data from IG

Overview
AstraZeneca plc is a British-Swedish pharmaceutical and biotechnology company that operates globally. Its innovative medicines are used by millions of patients worldwide. The company headquarters are based at the Cambridge Biomedical Campus in Cambridge, England.
Financials
Looking at the 2021 financial year versus 2020, total revenue rose by $10.8bn and gross profit rose by $3,662bn YoY. However, operating profit fell $4,104bn because of the rise in R&D, selling, and general and administrative expenses. As a result, profit for the period in 2021 totalled $115 million versus $3,144bn in 2020. Total assets jumped by a whopping $83.6bn and total liabilities only rose by just under $15bn. Bring the total equity of the company to $39,287bn, a 151% increase year-on-year. Additionally, cash and cash equivalents at the end of the 2021 period fell to $6,038bn from $7,546, although, this is due to higher repayments of loans and borrowings (over $3bn higher than in the previous year).
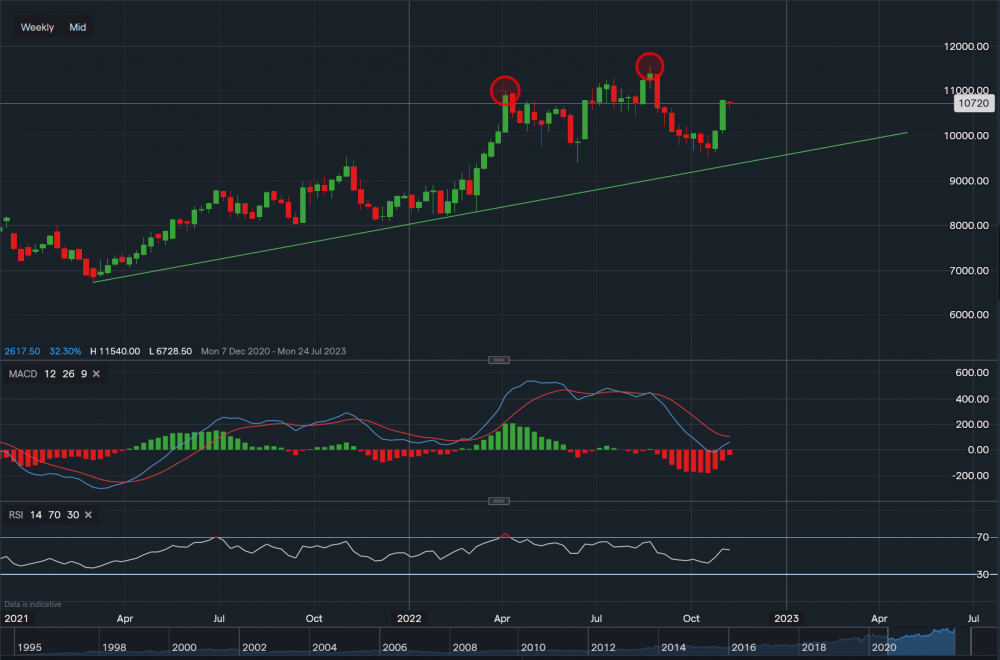
Technicals
From a technical aspect, the company’s shares are currently trading at £107.20 a share. Towards the upside, resistance sits at £109.99 (lower red oval) then at £112.90 then a major resistance level at £115.40 (higher red oval). A break above the major resistance may see the stock reach its all-time highs. Towards the downside, support levels sit at £105.32 then at £104.29 then at £102.06. A break below these support levels may see the share price fall towards the £95-£98 price range in the longer term. MACD is currently negative but swaying towards a neutral stance, and RSI is positive as it reads 56.