General Dynamics (GD) Fundamental and Technical Stock Analysis: Can the Defence Prime Keep Outperforming?
$364.70
04 Mar 2026, 12:54
Neutral

Join Minipip Academy and access free courses in investing, trading, economics, and more.
Sign Up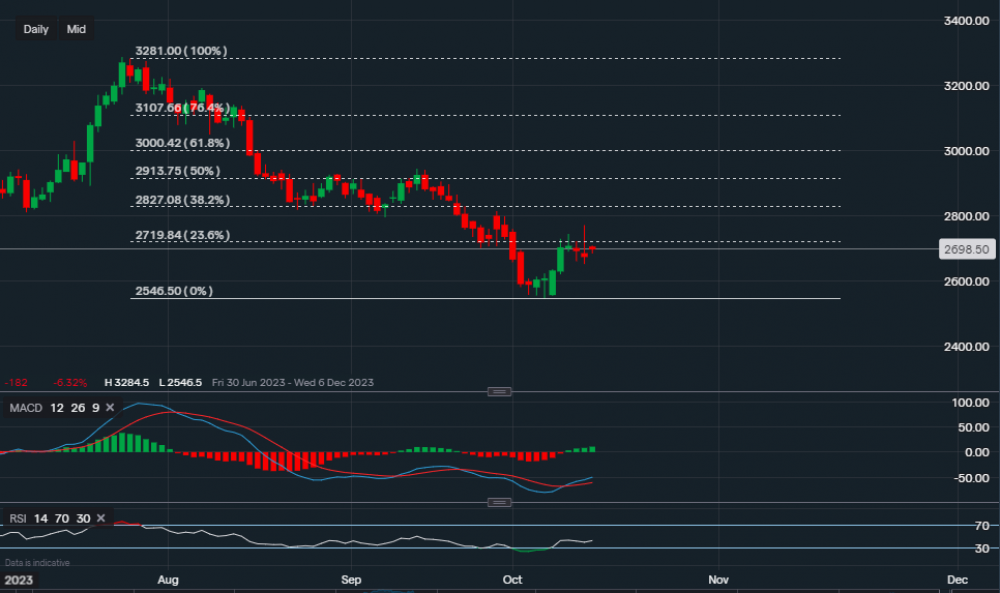
Chart & Data from IG
BoA’s stock is currently trading at around $26.98 a share. Looking at the chart from a technical aspect, we can see that after the recent sell-off, its stock is trying to fight back but it’s struggling at the moment. Applying the Fibonacci retracement to the chart, it is visible that the key support level now sits at $25.46. The price did indeed try to rebound last week but was soon spooked on the first hurdle, or respectively, the 23.6% fib ($27.19). A close above the 23.6% fib would suggest that perhaps that rebound wasn’t short-lived, in that case, we would then look at resistance levels at $28.27 (38.2% fib) and then the tough level at $29.13 (50% fib). Looking towards the downside, in the scenario of disappointing earnings, minor support sits at $26.52 and then at $25.46. As already mentioned above. A break below $25.46 could see BoA’s stock head as low as the COVID levels. The technical indicators are a little mixed at this moment in time, which tends to be the case often prior to an earnings report. The MACD is positive whereas the RSI is just negative as it reads 43.6.

Tradable assets:
Min.Deposit:
Max Leverage:
FCA:

Rating:


 Earnings Calendar
  Economic Calendar
  VAT Calculator
  Tax Free Childcare Calculator
 Percentage Calculator
 Compound Interest Calculator
  Loan Overpayment Calculator
 Mortgage Calculator
 Credit Card Calculator
 Investing
  Economics
 Trading
  Technical Analysis
  Personal Finance
 Calculator


