General Dynamics (GD) Fundamental and Technical Stock Analysis: Can the Defence Prime Keep Outperforming?
$364.70
04 Mar 2026, 12:54
Neutral

Join Minipip Academy and access free courses in investing, trading, economics, and more.
Sign Up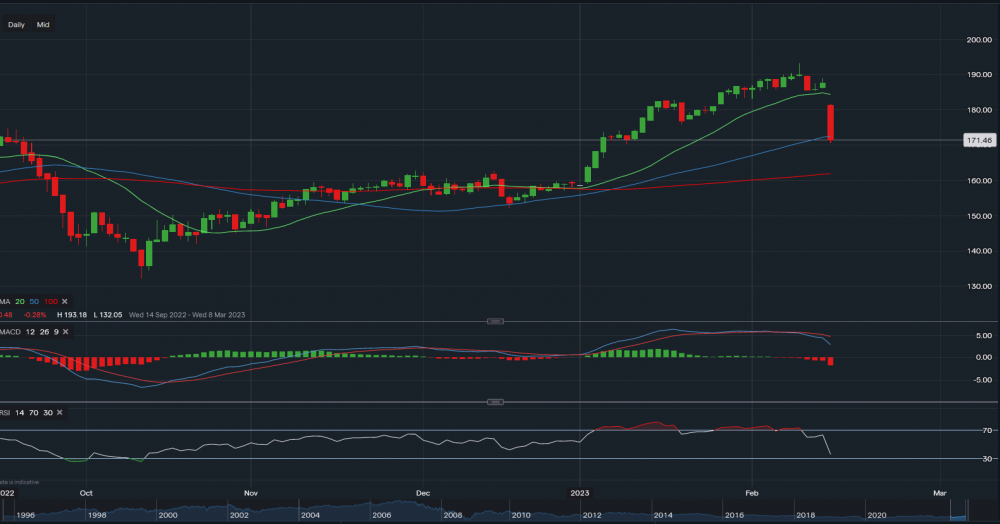
Barclays - Chart & Data from IG
From a technical perspective, Barclays’ shares are currently trading at 171p a share, down from 187p seen yesterday. This comes as a result of a 14% decline in its annual earnings, which were released earlier today. We can see that the price has dipped towards the 50-day moving average (172p), but at the moment this MA is acting as support until a close below occurs. If there is a close below, the next line of support sits at the 100-day moving average (currently 161p). Medium-term, if the 100-day MA was to be broken, the price of Barclays’ shares could fall as far as 152p. On the other hand, if consolidation is found within the next week, today’s open price of 181p will then act as resistance. A break above 181p would face resistance at 182p, only a break above 182p could see the price climb back up its previous level of 190p. Taking a look at the technical indicators, MACD has turned negative and so is RSI as it reads 35. Although, the vision of this stock’s price will be cloudy until at least the beginning of next week. Today’s close will be key. Barclays' shares are down 8% so far for the day.


 Earnings Calendar
  Economic Calendar
  VAT Calculator
  Tax Free Childcare Calculator
 Percentage Calculator
 Compound Interest Calculator
  Loan Overpayment Calculator
 Mortgage Calculator
 Credit Card Calculator
 Investing
  Economics
 Trading
  Technical Analysis
  Personal Finance
 Calculator


