AbbVie (ABBV) Stock Analysis: Humira Decline, New Drug Growth, and Technical Consolidation
$228.47
06 Mar 2026, 17:58
Neutral

Join Minipip Academy and access free courses in investing, trading, economics, and more.
Sign Up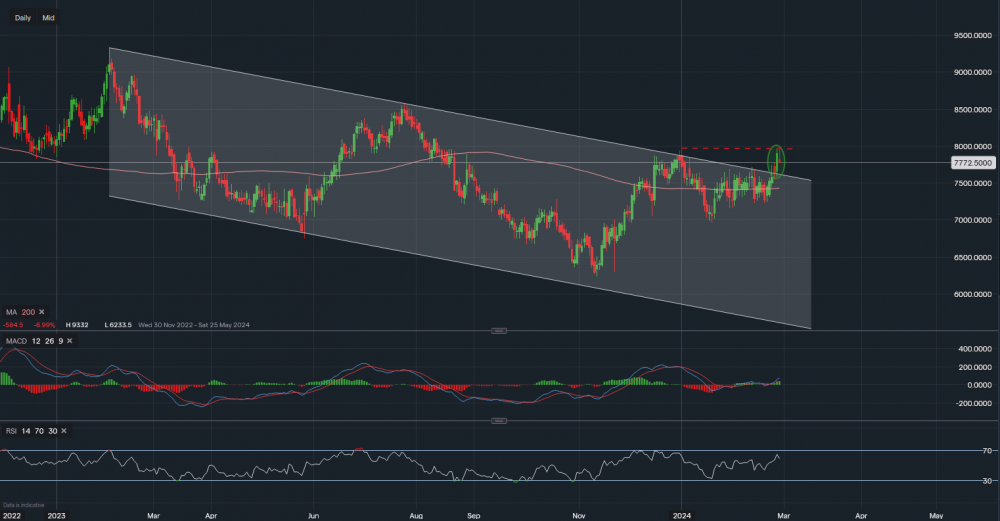
Chart & Data from IG
Looks like a possible breakout towards the upside here for Best Buy on the daily interval. Currently, its shares are trading at around $77.72 a share, We can see that from February last year till February this year, the share price has been trading within the bearish channel on the chart. Earlier in February this year, the price managed to find a new support base near the upper half of the channel, which seems to be supported by its 200-day moving average. This consolidation led to a break higher, potentially the beginning of the new bullish trend. The price has now approached the resistance of $79.72, where it has been rejected from moving higher. However, a break above this level would certainly confirm the bullish momentum with then a possible move towards $85 a share. The key support here is now along the 200MA, which currently reads $74.31. Further support sits at $71.59 followed by $69.60. Looking at the technical indicators, they are now rather positive. The MACD is rising and the RSI reads 59. However, it has now dipped a little after the rejection from the resistance.

Tradable assets:
Min.Deposit:
Max Leverage:
FCA:

Rating:


 Earnings Calendar
  Economic Calendar
  VAT Calculator
  Tax Free Childcare Calculator
 Percentage Calculator
 Compound Interest Calculator
  Loan Overpayment Calculator
 Mortgage Calculator
 Credit Card Calculator
 Investing
  Economics
 Trading
  Technical Analysis
  Personal Finance
 Calculator


