General Dynamics (GD) Fundamental and Technical Stock Analysis: Can the Defence Prime Keep Outperforming?
$364.70
04 Mar 2026, 12:54
Neutral

Join Minipip Academy and access free courses in investing, trading, economics, and more.
Sign Up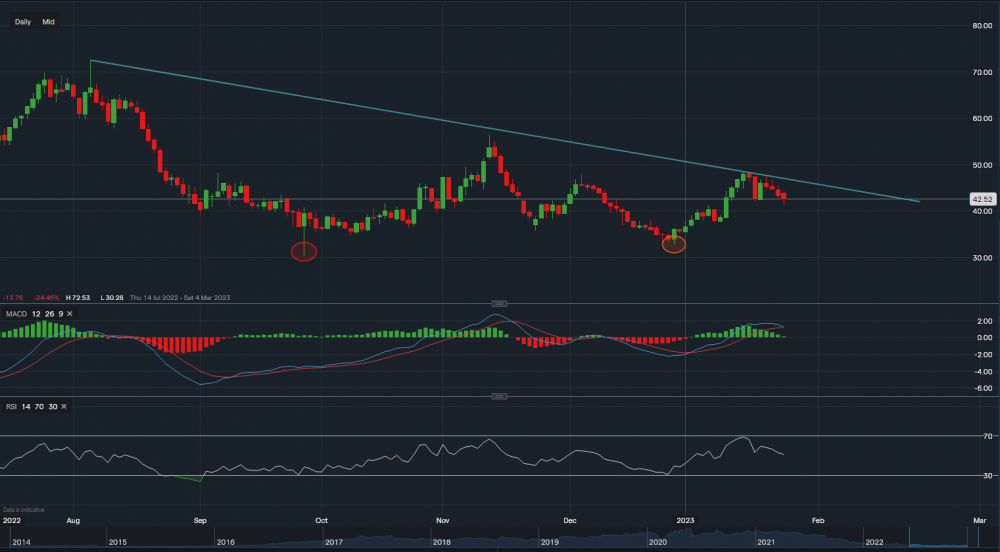
Boohoo - Chart & Data from IG
Financials
Looking at Boohoo’s interim results for the six months ending 31st of August 2022, its revenue and gross profit both saw a decline. Revenue fell by £93m and gross fell £70m. After the EBITDA was adjusted, an 85% decline was reported in the prior year with an EPS (earnings per share) of £0.30. This actually left the company in net debt of £10.4m for the specified period. However, with £315 million in gross cash and a low level of net debt (£10 million) at the end of the first half, the Group continues to maintain a strong balance sheet, providing sufficient liquidity headroom that allows selected investments in strategic growth projects.
Technicals
Its share price currently sits around 42.52p a share. Looking at the chart on the daily timeframe, we can see resistance was almost tested on the 11th of November but was rejected. Then resistance was tested on the 18th of January at the price of 48.43p but was rejected once more, and now heading lower once again. Current resistance levels sit at 44.67p then at 45.91p then a key level at 46.40p (corresponds with the trendline). A clear break above 46.40p could form a bullish trend, creating a spark that this stock has been seeking for months and months. However, until that might happen, support sits at 42.01p then at 39.01p then at 35.67p. A break below 35.67p could see the key support levels tested at 32.60p (orange oval) and then at 30.28p (red oval). MACD is practically neutral and seems like it could turn negative over the next couple of trading days. RSI is neutral but also faltering as it reads 50.


 Earnings Calendar
  Economic Calendar
  VAT Calculator
  Tax Free Childcare Calculator
 Percentage Calculator
 Compound Interest Calculator
  Loan Overpayment Calculator
 Mortgage Calculator
 Credit Card Calculator
 Investing
  Economics
 Trading
  Technical Analysis
  Personal Finance
 Calculator


