General Dynamics (GD) Fundamental and Technical Stock Analysis: Can the Defence Prime Keep Outperforming?
$364.70
04 Mar 2026, 12:54
Neutral

Join Minipip Academy and access free courses in investing, trading, economics, and more.
Sign Up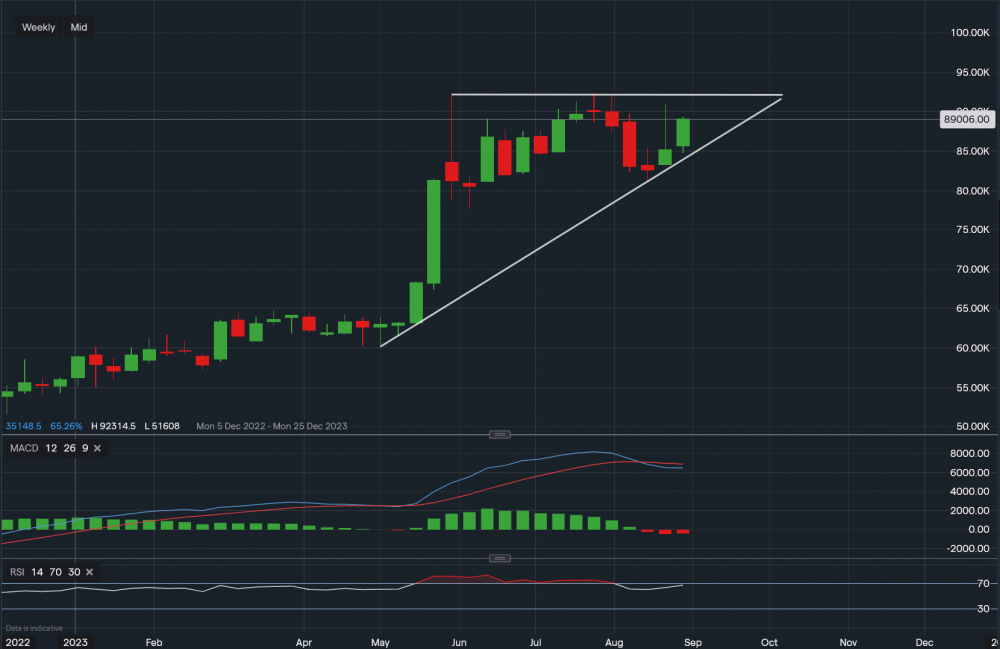
Chart & Data from IG
Broadcom’s stock is trading at around $890.06 a share. We can see the bullish momentum seems to be holding on with last week bouncing off the trendline support. Now resistance remains at the upper trendline of the triangle on the chart. $921.52 followed by $923.14. A break and close above it could see the price rise higher setting new all-time highs. Support sits at $830.94, a break below it would first have to test the support of $812.25 before anticipating any further downside moves. Broadcom is due to report earnings tomorrow, this may have a huge influence on the short to mid term outlook. Looking at the technical indicators on the weekly interval, MACD is negative but volume is flat and the RSI is still positive as it reads 67. Slightly mixed approach until the earnings release.

Tradable assets:
Min.Deposit:
Max Leverage:
FCA:

Rating:


 Earnings Calendar
  Economic Calendar
  VAT Calculator
  Tax Free Childcare Calculator
 Percentage Calculator
 Compound Interest Calculator
  Loan Overpayment Calculator
 Mortgage Calculator
 Credit Card Calculator
 Investing
  Economics
 Trading
  Technical Analysis
  Personal Finance
 Calculator


