General Dynamics (GD) Fundamental and Technical Stock Analysis: Can the Defence Prime Keep Outperforming?
$364.70
04 Mar 2026, 12:54
Neutral

Join Minipip Academy and access free courses in investing, trading, economics, and more.
Sign Up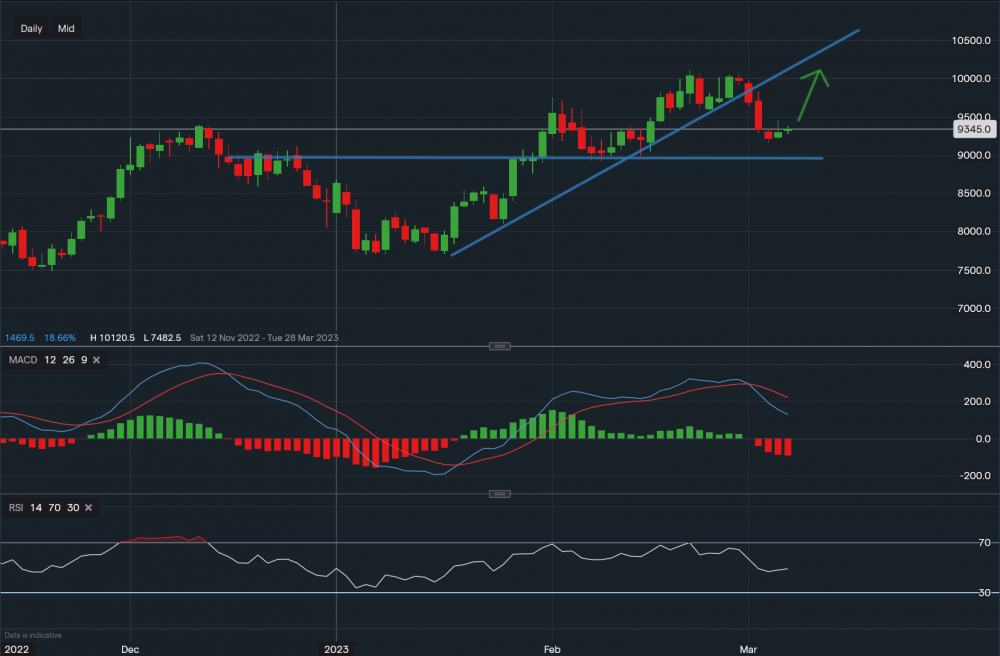
Carbon Emissions - Chart Data IG
Carbon emissions broke its original trendline support on 1st march, however, the commodity seems to be forming a base around the €92.00 region. Further support is below at €89.50 region. Towards the upside, tough resistance sits at €100.00. MACD does remain negative with a high divergence, along with RSI reading 48.5 suggesting a minor negative trend for the moment, however, a touch of lower support could bring a good buying opportunity. If 89.50 fails then further support sits at the swing high of €85.09.


 Earnings Calendar
  Economic Calendar
  VAT Calculator
  Tax Free Childcare Calculator
 Percentage Calculator
 Compound Interest Calculator
  Loan Overpayment Calculator
 Mortgage Calculator
 Credit Card Calculator
 Investing
  Economics
 Trading
  Technical Analysis
  Personal Finance
 Calculator


