General Dynamics (GD) Fundamental and Technical Stock Analysis: Can the Defence Prime Keep Outperforming?
$364.70
04 Mar 2026, 12:54
Neutral

Join Minipip Academy and access free courses in investing, trading, economics, and more.
Sign Up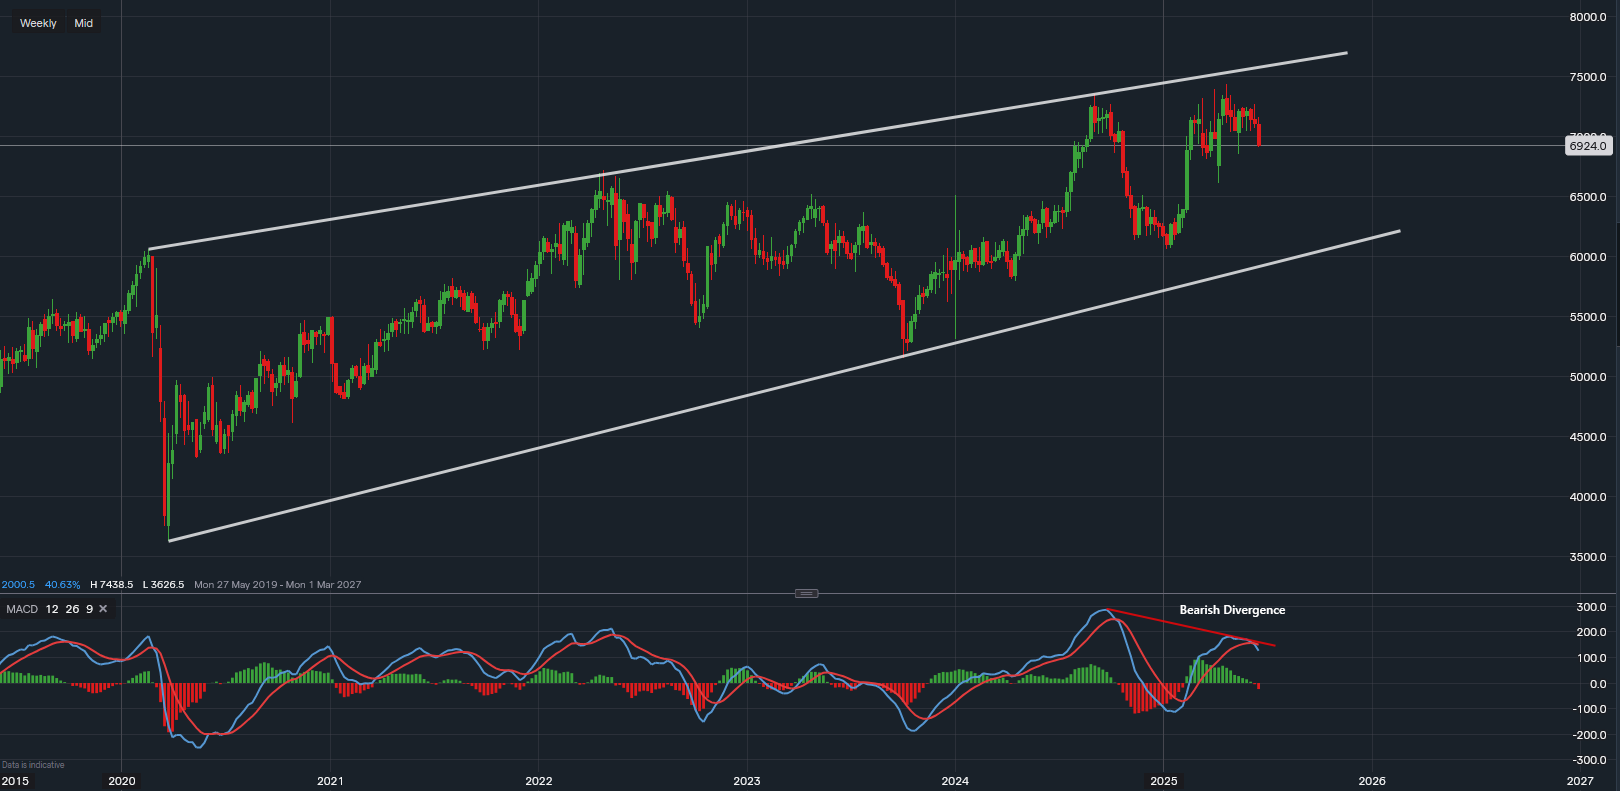
Chart & Data from IG
Coca-Cola Co. (NYSE: KO) is currently showing signs of a bearish divergence on the MACD indicator on the weekly chart, raising concerns among technical traders and investors. As of the latest close, the beverage giant’s stock ended at $69.24 per share. With the US markets closed for a public holiday, attention now turns to how the market will react at tomorrow’s open.
The stock has faced strong resistance around the $73 to $74 range, struggling to break above this level for the second time in April. This failure may have triggered recent profit-taking activity among investors, capping further gains in the short term.
The MACD (Moving Average Convergence Divergence) has recently turned bearish, suggesting momentum is shifting towards the downside. This could lead to increased selling pressure heading into the summer months. Technical traders may interpret this shift as a signal for a potential deeper sell-off.
Near-term support is currently seen at $68.58, followed by the April low of $66.14. A decisive break below this level could pave the way for further downside, with the next major support area sitting around the lower trendline of the Covid-era channel, estimated between $61 and $65.
On the upside, a break above $74 would be required to invalidate the current bearish outlook. Such a move could indicate renewed bullish momentum and open the door for a test of the upper trendline near $76, which may act as tactical resistance in the near term.

Tradable assets:
Min.Deposit:
Max Leverage:
FCA:

Rating:


 Earnings Calendar
  Economic Calendar
  VAT Calculator
  Tax Free Childcare Calculator
 Percentage Calculator
 Compound Interest Calculator
  Loan Overpayment Calculator
 Mortgage Calculator
 Credit Card Calculator
 Investing
  Economics
 Trading
  Technical Analysis
  Personal Finance
 Calculator


