General Dynamics (GD) Fundamental and Technical Stock Analysis: Can the Defence Prime Keep Outperforming?
$364.70
04 Mar 2026, 12:54
Neutral

Join Minipip Academy and access free courses in investing, trading, economics, and more.
Sign Up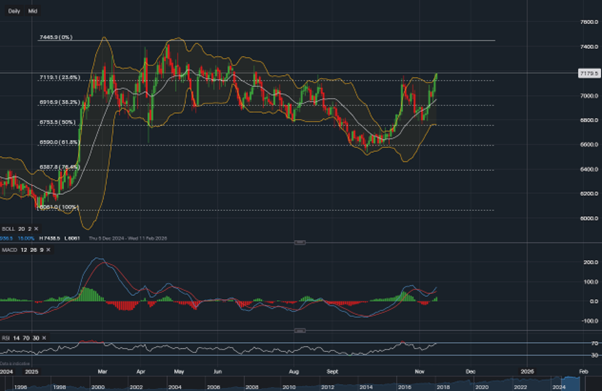
Coca-Cola Stock Analysis: Cup and Handle Pattern Signals Potential Breakout
Coca-Cola Stock Analysis: Cup and Handle Pattern Signals Potential Breakout
Coca-Cola (KO) Shows Strong Bullish Momentum
After a solid week of performance, Coca-Cola (NYSE: KO) has completed a strong bullish pullback, forming a classic cup and handle pattern—a setup previously predicted in some of Minipip’s earlier analyses. This pattern often signals a potential long-term buying opportunity for investors, especially if Coca-Cola’s share price confirms a positive breakout in the coming days.
Technical Analysis: Breakout Signals Emerging
From a technical perspective, there are several indicators suggesting that a Coca-Cola breakout could be imminent.
Coca-Cola’s share price has recently broken above a key Fibonacci resistance line at $71.19, a level that has acted as resistance twice before—both at the start and end of the cup formation. A successful breakout from this level could pave the way for sustained upward movement.
Moreover, the weekly MACD indicator has transitioned into a growing bullish signal, which is further supported by the daily MACD. This alignment between multiple timeframes adds strength to the bullish outlook for Coca-Cola’s stock.
Fundamental Analysis: Strong Value Indicators
Coca-Cola’s fundamentals also support its long-term growth potential. The company currently trades at a P/E ratio of 23.70 and a forward P/E of 22.27, suggesting that Coca-Cola remains reasonably valued relative to its earnings potential.
Analyst predictions further reinforce this outlook, with an average price target of $79.08, representing a potential upside of 10.43% from current levels. These valuations underline investor confidence in Coca-Cola’s ability to maintain consistent earnings growth.
Short-Term Outlook: Possible Retracement Ahead
Despite the overall bullish sentiment, short-term traders should remain cautious. Coca-Cola’s RSI is currently at 68, indicating that the stock is nearing overbought territory. Additionally, the share price is sitting on the upper Bollinger Band, suggesting that a minor pullback or consolidation phase could occur before the next leg higher.
If a retracement does materialise, possible support levels lie around $71.19 (Fibonacci support) and $69.17, both of which could act as buying zones for investors looking to enter on dips.
Outlook for Traders and Long-Term Investors
With the cup and handle pattern now confirmed and a potential breakout forming, Coca-Cola investors have several key levels and indicators to monitor. Traders should keep an eye on breakout confirmation above $71.19, while investors may want to look for opportunities during any short-term retracement.
Overall, Coca-Cola’s combination of technical strength and solid fundamentals points towards a promising long-term bullish outlook, though patience and careful entry timing remain essential.

Tradable assets:
Min.Deposit:
Max Leverage:
FCA:

Rating:


 Earnings Calendar
  Economic Calendar
  VAT Calculator
  Tax Free Childcare Calculator
 Percentage Calculator
 Compound Interest Calculator
  Loan Overpayment Calculator
 Mortgage Calculator
 Credit Card Calculator
 Investing
  Economics
 Trading
  Technical Analysis
  Personal Finance
 Calculator


