General Dynamics (GD) Fundamental and Technical Stock Analysis: Can the Defence Prime Keep Outperforming?
$364.70
04 Mar 2026, 12:54
Neutral

Join Minipip Academy and access free courses in investing, trading, economics, and more.
Sign Up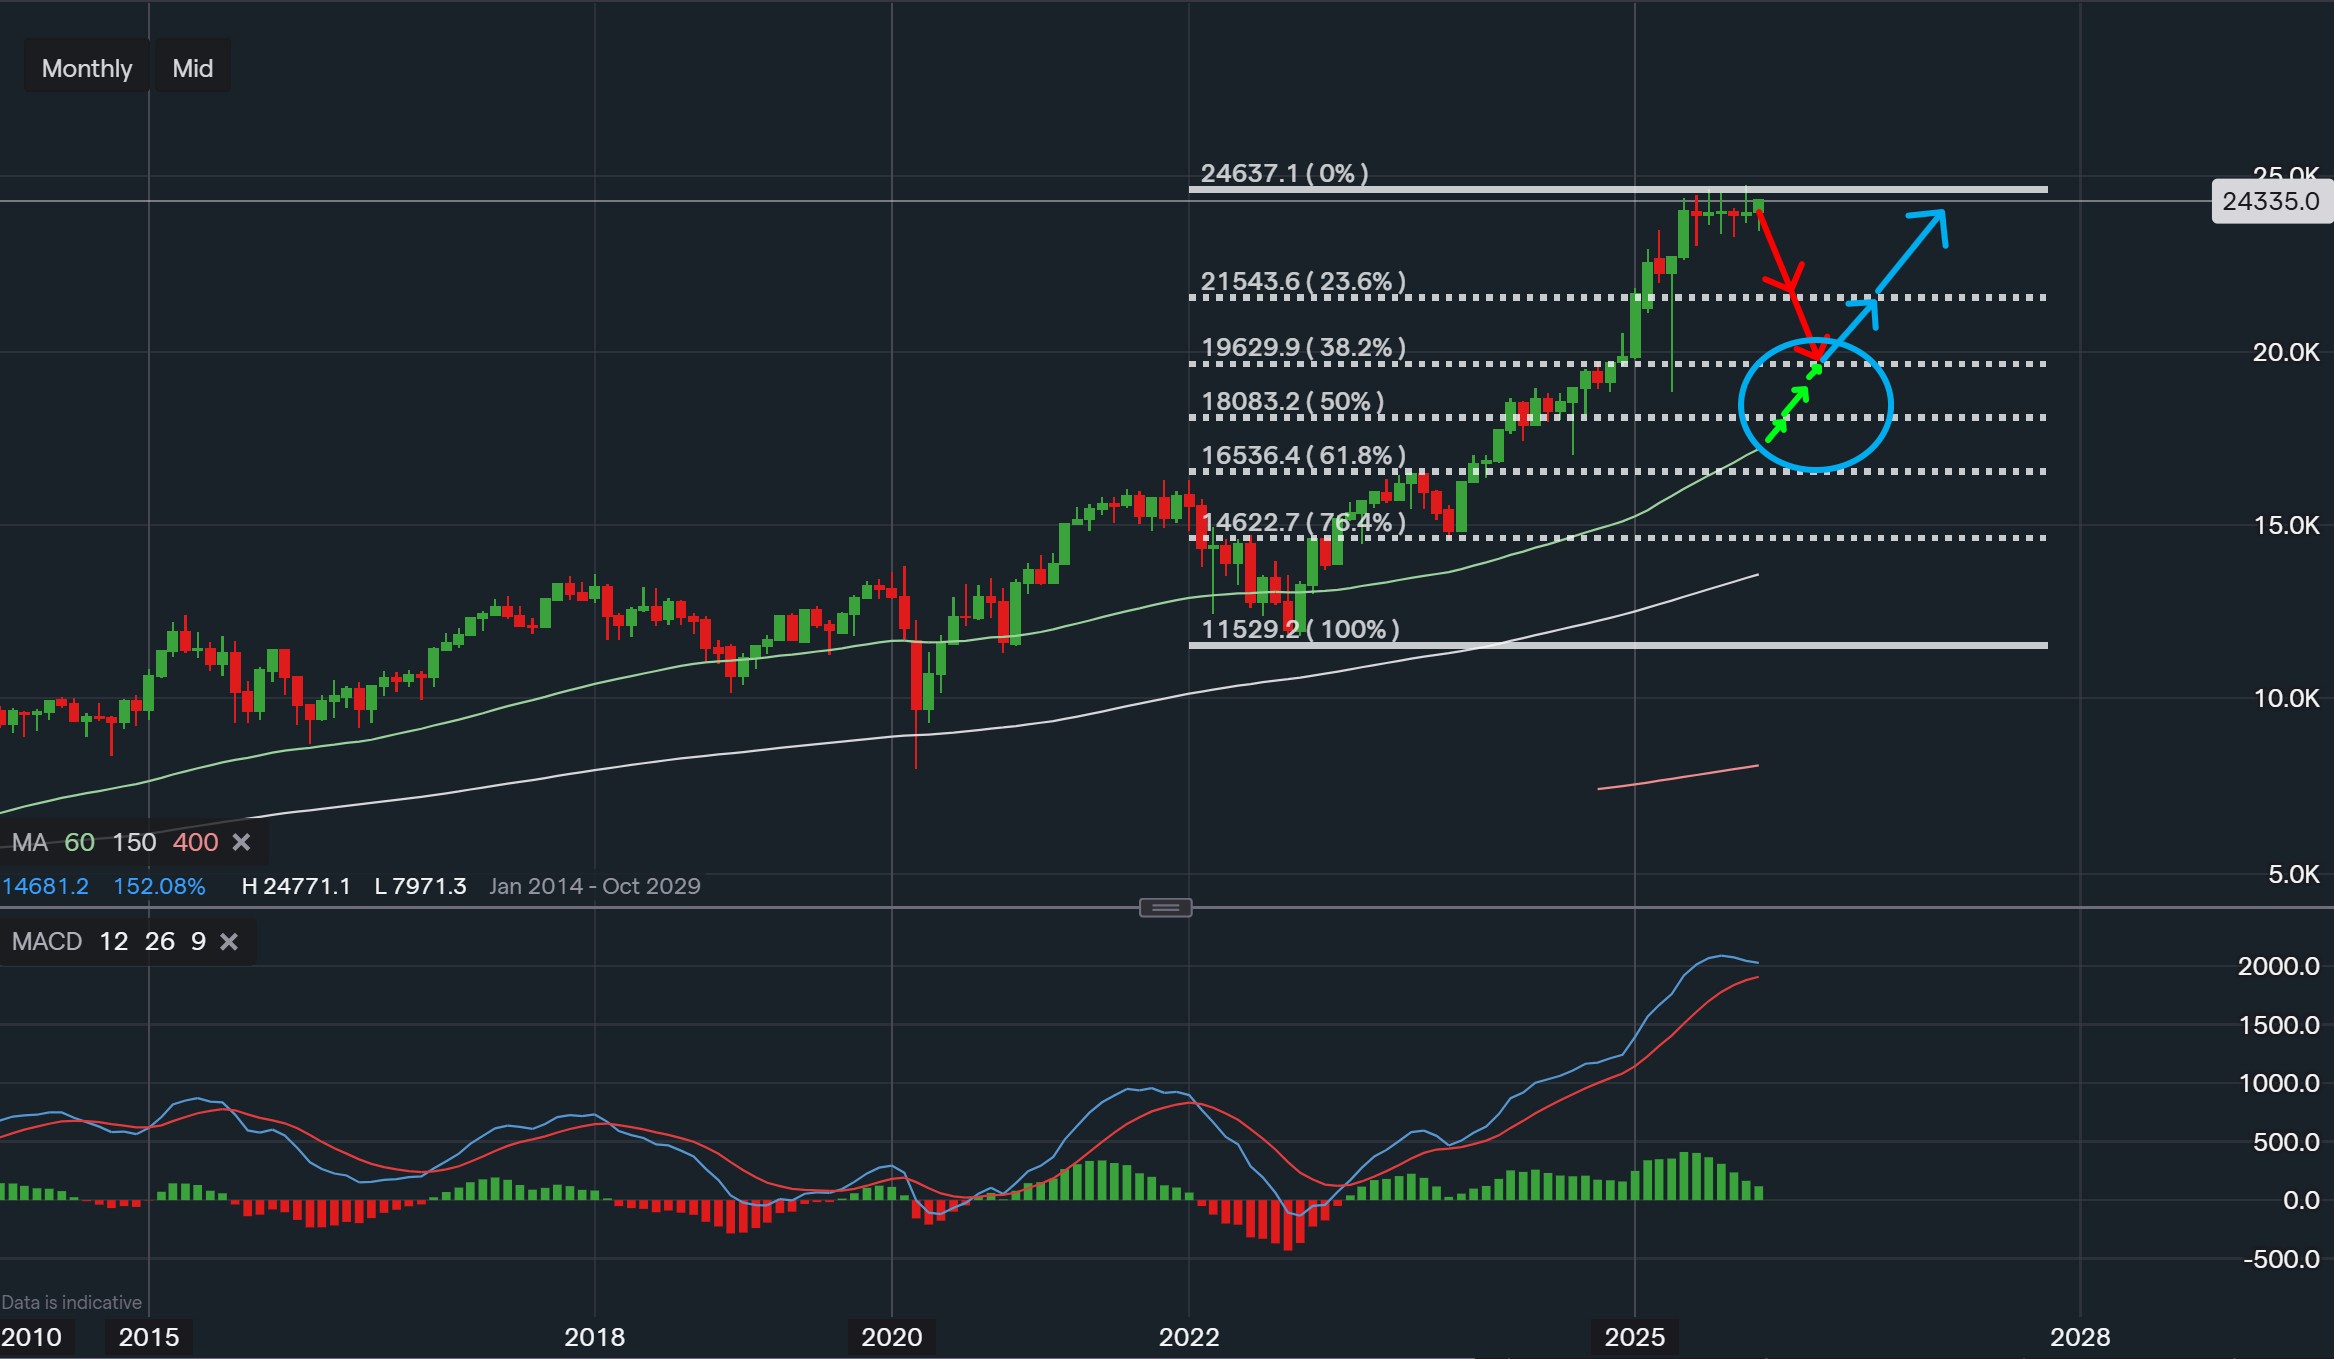
Data from IG - Timeframe - Monthly
Market Overview
The DAX 40, Germany’s leading stock market index, remains firmly in a long-term uptrend, supported by a consistent pattern of higher highs and higher lows. However, the latest monthly chart indicates a potential short-term cooling as the price trades well above its key 60-month moving average. This overextension suggests that the index may be preparing for a controlled pullback before resuming its broader bullish trend. Despite near-term softness, the long-term structure continues to reflect strength across the German and wider European equity markets.
Technical Structure and Key Levels
The chart shows that the 60-moving average is currently sitting around the 61.8% Fibonacci retracement level near 17,000, creating a strong area of support where larger investors may look to buy. Recently, price action has started to slow down near the upper Fibonacci levels, with several candle wicks forming close together — a sign of uncertainty and increased market activity. This pattern suggests a short-term resistance zone, where buyers and sellers are battling for direction. If the market pulls back, potential support could form between 18,000 and 19,000, while the next major resistance remains near the 24,637 high.
Momentum and Market Sentiment
The MACD indicator currently supports the idea of a short-term pullback. The MACD line is approaching a potential bearish crossover with the signal line, often a precursor to temporary downward momentum within broader uptrends. This reinforces the view that the market may enter a consolidation phase before regaining bullish strength. As the months progress, the moving averages are expected to move closer to price, potentially providing renewed technical support for the next upward leg.
Potential Opportunities and Outcomes
For traders and investors observing the DAX 40 forecast, a controlled retracement could offer fresh entry opportunities within the overall uptrend. A rebound from the Fibonacci support zone would likely validate bullish continuation towards the 24,600–25,000 area. However, if price closes below the 61.8% level, a deeper correction could unfold, though this would still align with a cyclical consolidation phase rather than a full trend reversal. The key to confirming direction lies in how price reacts around these technical inflection points.
Conclusion
In summary, the DAX 40 technical analysis suggests that while a short-term pullback is probable due to overextension and softening momentum, the broader bullish trend remains intact. The confluence of Fibonacci support and long-term moving averages continues to underpin a constructive outlook. Observing how price behaves within the 18,000–19,000 region will be crucial in identifying when the next wave of bullish momentum is ready to resume.
Disclaimer
This analysis is for educational purposes only and does not constitute financial advice or investment guidance. Market conditions may change quickly, so always conduct your own research before making decisions.

Tradable assets:
Min.Deposit:
Max Leverage:
FCA:

Rating:


 Earnings Calendar
  Economic Calendar
  VAT Calculator
  Tax Free Childcare Calculator
 Percentage Calculator
 Compound Interest Calculator
  Loan Overpayment Calculator
 Mortgage Calculator
 Credit Card Calculator
 Investing
  Economics
 Trading
  Technical Analysis
  Personal Finance
 Calculator


