General Dynamics (GD) Fundamental and Technical Stock Analysis: Can the Defence Prime Keep Outperforming?
$364.70
04 Mar 2026, 12:54
Neutral

Join Minipip Academy and access free courses in investing, trading, economics, and more.
Sign Up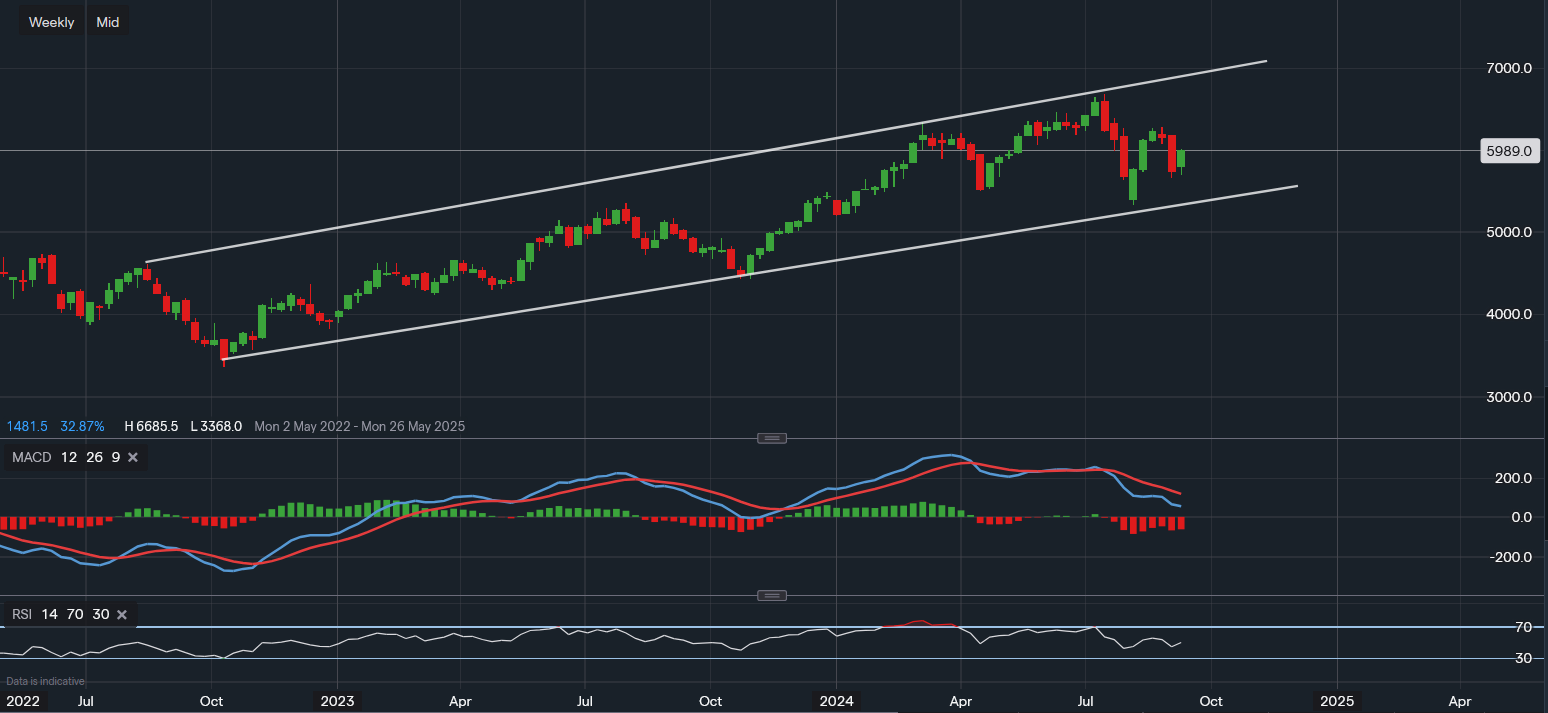
Chart & Data from IG
Defiance Quantum ETF continues to trade in an uptrend and remains within the channel. After testing the support along the lower trendline of the channel, it is now trading at around $59.89 following some recovery in recent weeks. This week’s candlestick is heading for a positive week, a close in the green would, in theory, make a stronger statement for a higher low, establishing a new support level at $56.65 a share. A move below this support level could lead to yet another test of trendline support around $53.75. Investors should be aware of this possibility as the technical indicators are still in bearish positioning, the MACD does not seem like it’s starting to flatten and the RSI has only just come out of bearish territory (reads 50). However, as they are lagging indicators the price could just as easily grind its way higher. Hence, the first resistance to keep an eye on for the upside reads around $62.66. A move above would shift the focus to $63.43 followed by $64.63 and finally the high of $66.85.

Tradable assets:
Min.Deposit:
Max Leverage:
FCA:

Rating:


 Earnings Calendar
  Economic Calendar
  VAT Calculator
  Tax Free Childcare Calculator
 Percentage Calculator
 Compound Interest Calculator
  Loan Overpayment Calculator
 Mortgage Calculator
 Credit Card Calculator
 Investing
  Economics
 Trading
  Technical Analysis
  Personal Finance
 Calculator


