General Dynamics (GD) Fundamental and Technical Stock Analysis: Can the Defence Prime Keep Outperforming?
$364.70
04 Mar 2026, 12:54
Neutral

Join Minipip Academy and access free courses in investing, trading, economics, and more.
Sign Up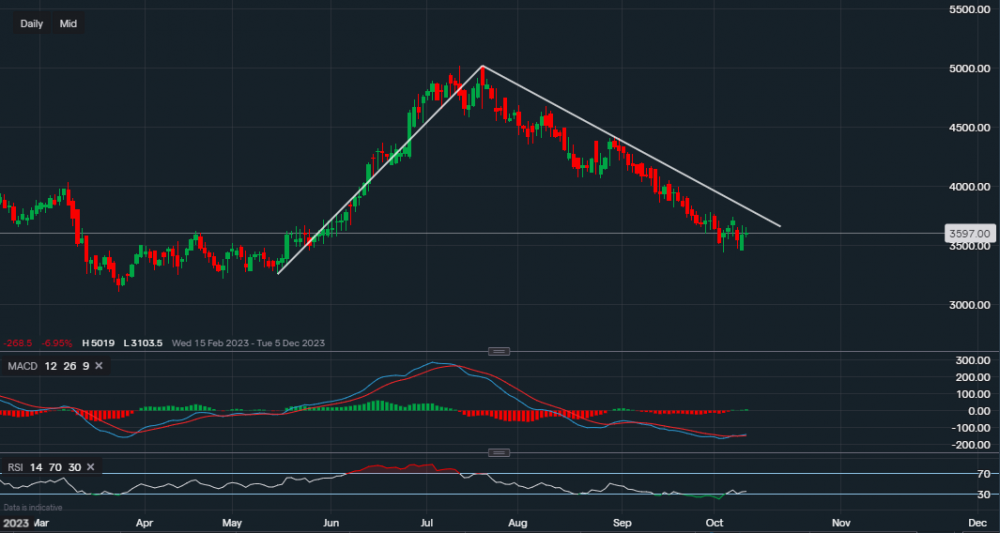
Chart & Data from IG
Delta Air Lines is expected to report quarterly earnings tomorrow, the airline company is expected to report earnings of $1.97 on revenue of $14.55bn. Currently, its stock is trading at around $35.97 a share. On the basis of a daily timeframe, we can see that the price rose sharply between May and July, reaching a high of $50.17. But also since July, it has declined almost just as sharply as it increased. The trendlines drawn on the chart emphasize this movement. Nevertheless, its price has been forming higher highs and higher lows along the way, perhaps suggesting that a long-term trend is still in place. We can see a low of $34.34 on the 4th of October was reached, which was almost tested on the 10th of October as the stock recorded a low of $34.58 that day. On the 4th of October, the session closed as a green hammer doji, which tends to be a bullish signal. The attempted re-test on the 10th suggests that a small support base may have formed, which in turn would mean that a new higher low has been created. If that is the case, we could see the price break towards the upside. The resistance currently sits at $36.66 (yesterday’s high) and then at $37.50 (along the descending trendline). A break above the trendline could result in the resumption of this longer-term bullish trend. If we look at the technical indicators, we can see that the MACD line has just crossed above the signal line (positive interpretation) and the RSI has wiggled its way out of the ‘oversold’ area as it now reads 35.
Minipip’s Opinion - investors/traders should be cautious of any false breakouts.

Tradable assets:
Min.Deposit:
Max Leverage:
FCA:

Rating:


 Earnings Calendar
  Economic Calendar
  VAT Calculator
  Tax Free Childcare Calculator
 Percentage Calculator
 Compound Interest Calculator
  Loan Overpayment Calculator
 Mortgage Calculator
 Credit Card Calculator
 Investing
  Economics
 Trading
  Technical Analysis
  Personal Finance
 Calculator


