General Dynamics (GD) Fundamental and Technical Stock Analysis: Can the Defence Prime Keep Outperforming?
$364.70
04 Mar 2026, 12:54
Neutral

Join Minipip Academy and access free courses in investing, trading, economics, and more.
Sign Up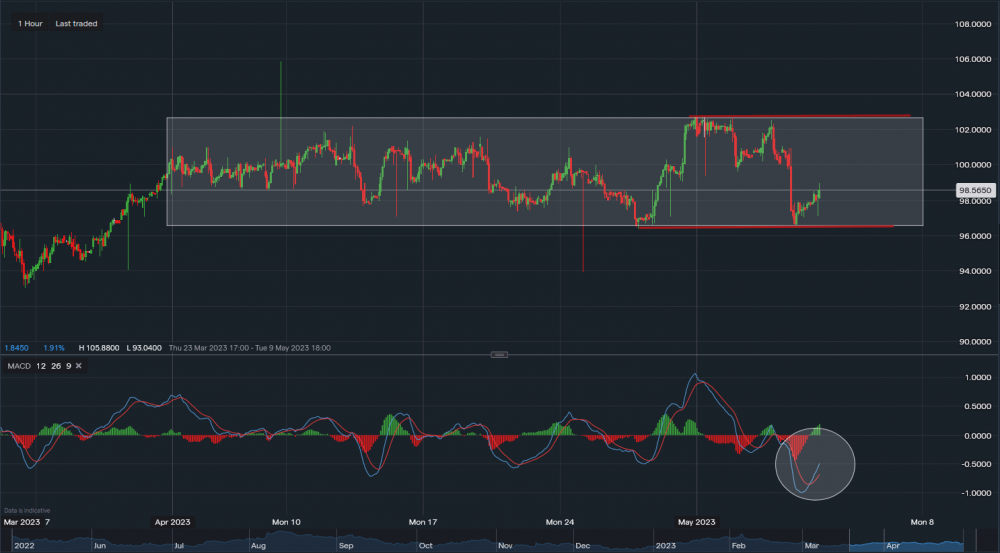
Chart & Data from IG
Disney continues to stay within its range dating back to early April. MACD has just turned positive on the 1 hourly as well as on the 2 hourly timeframes. On the 4 hourly the divergence is closing but still negative. Towards the downside, support for Disney sits at $96.47. A break and close below this level on the daily timeframe could then put pressure on the stock. Towards the upside, resistance sits at $102.79. A break above here could take Disney looking towards $120. According to tipranks.com out of 21 analyst ratings 18 are 'buy' with 3 'hold' and 0 'sell'. Which is positive.


 Earnings Calendar
  Economic Calendar
  VAT Calculator
  Tax Free Childcare Calculator
 Percentage Calculator
 Compound Interest Calculator
  Loan Overpayment Calculator
 Mortgage Calculator
 Credit Card Calculator
 Investing
  Economics
 Trading
  Technical Analysis
  Personal Finance
 Calculator


