General Dynamics (GD) Fundamental and Technical Stock Analysis: Can the Defence Prime Keep Outperforming?
$364.70
04 Mar 2026, 12:54
Neutral

Join Minipip Academy and access free courses in investing, trading, economics, and more.
Sign Up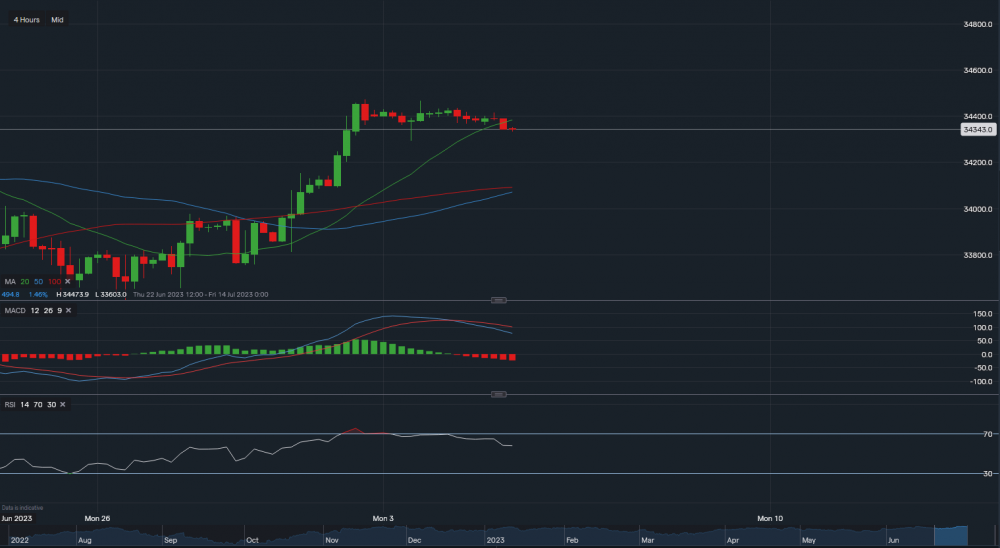
Chart & Data from IG
The Dow Jones index has just crossed below the 20-day moving average on the 4-hourly timeframe. This tends to be an indication that some downside movements could occur, however, with the US bank holiday yesterday and the FOMC meeting upcoming today, this is also what the market does to catch traders. Currently, the Dow is trading at around 34,343, in theory, we would now look at support levels sitting at 34,293. A break below 34,293 would open the possibility of a retracement lower towards the 100-day moving average (34,092). On the other hand, as the markets can be deceiving, on a day like today it may just remain rangebound between the high of 34,473 and the low of 34,293. Which makes it difficult to trade and anticipate any movement. Looking at the technical indicators, the MACD has turned negative but the RSI is still pretty positive. Suggesting mixed signals, which in turn is a higher risk.
Note: Traders should be cautious of trading today as volatility could be tricky compared to usual.

Tradable assets:
Min.Deposit:
Max Leverage:
FCA:

Rating:


 Earnings Calendar
  Economic Calendar
  VAT Calculator
  Tax Free Childcare Calculator
 Percentage Calculator
 Compound Interest Calculator
  Loan Overpayment Calculator
 Mortgage Calculator
 Credit Card Calculator
 Investing
  Economics
 Trading
  Technical Analysis
  Personal Finance
 Calculator


