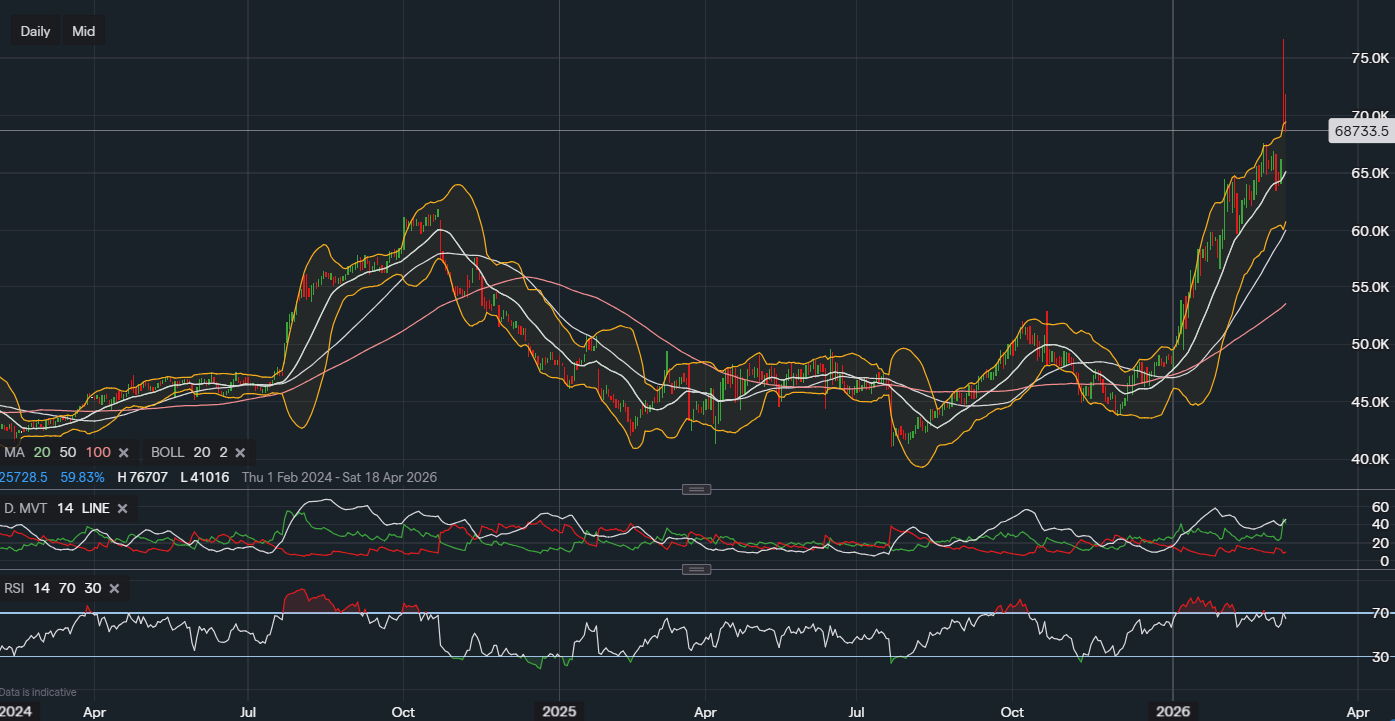
BAE Systems (BA.L) Stock Analysis: Bullish Trend, Defence Premium & Geopolitical Outlook 2026
$2227p
02 Mar 2026, 17:30
Bullish

Join Minipip Academy and access free courses in investing, trading, economics, and more.
Sign Up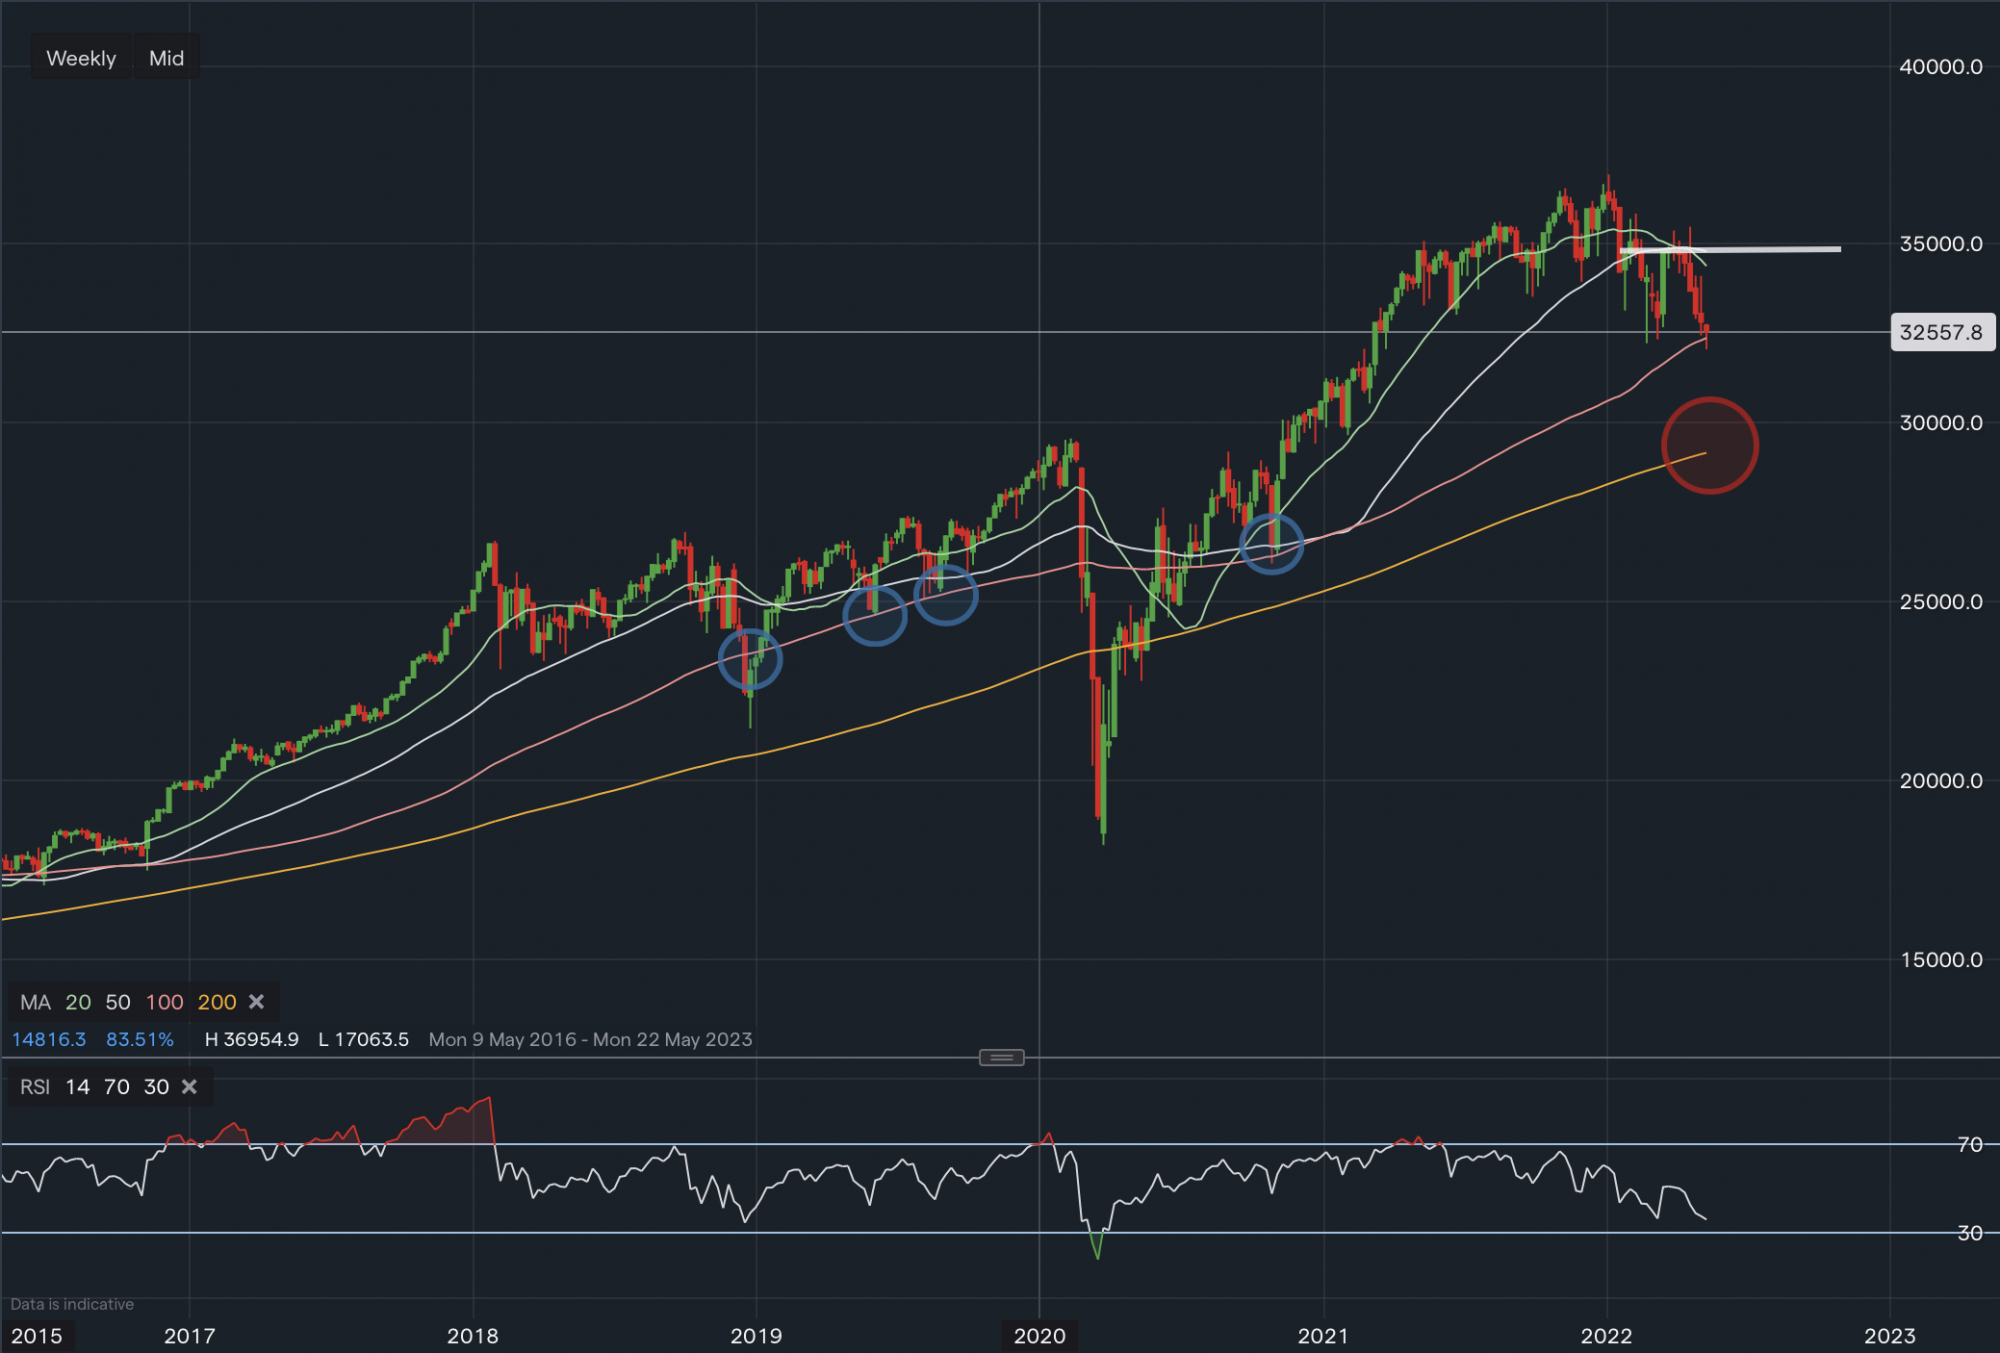
Technicals
The Dow Jones has been hit hard this year falling 11.5% YTD. This isn't as bad as the NASDAQ or SP500, however its still not great. Given this fall the technicals do provide some stability at its current level, but ONLY if the support at 32,380 holds. This is the 100-day moving average. A break and close below here on the weekly could cause the Dow to fall towards the red circle at 28,992, Which suggest another 9.3% slide from its current price. The 100-day moving average has held as support in the past (shown with the blue circles) so it is possible that we could have a bounce here on a weekly timeframe (maybe for 1-2 weeks), however its unlikely that a full recovery back to the highs will happen given the tensions, war and inflation around the world. There is also a large technical resistance at 34,900-35,000 where 2 swing highs sit along with the 20 and 50-day moving averages. If this level breaks, only then would the outlook start to become positive.


 Earnings Calendar
  Economic Calendar
  VAT Calculator
  Tax Free Childcare Calculator
 Percentage Calculator
 Compound Interest Calculator
  Loan Overpayment Calculator
 Mortgage Calculator
 Credit Card Calculator
 Investing
  Economics
 Trading
  Technical Analysis
  Personal Finance
 Calculator